🔍 Market Context:
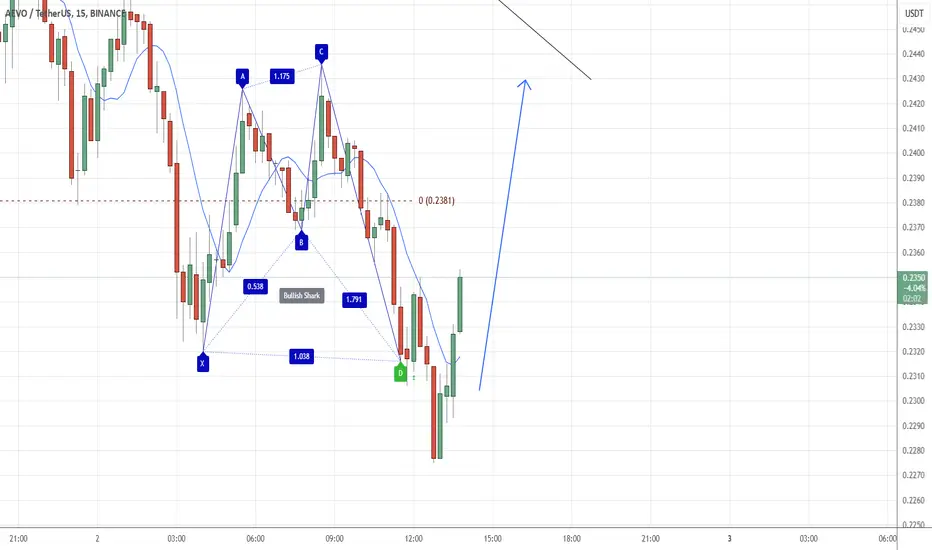
- AEVO/USDT is currently showing signs of a bullish reversal after reaching a low point.
- The price has bounced from a key support level, near the 0.2320 area, forming a potential bullish shark pattern.
- Fibonacci retracement levels and previous price action suggest resistance zones to watch above.
📊 Trade Entry Criteria:
- The price has reacted strongly at the 0.2320 support, with a sharp upward movement forming a potential bullish pattern.
- A bullish confirmation is expected if the price breaks above 0.2345 resistance, continuing the upward move.
- A rejection from the resistance could result in a retest of the lower levels.
🎯 Trade Targets & Risk Management
- Bullish Scenario:
- Entry Price: Above 0.2345 USDT
- Take Profit (TP1): 0.2380 USDT (38.2% Fibonacci)
- Take Profit (TP2): 0.2400 - 0.2420 USDT (50%-61.8% Fibonacci)
- Stop Loss (SL): Below 0.2320 USDT
- Bearish Scenario:
- Entry Price: Below 0.2320 USDT (break of support)
- Take Profit (TP1): 0.2300 USDT (27.2% Fib extension)
- Take Profit (TP2): 0.2270 USDT (61.8% Fib extension)
- Stop Loss (SL): Above 0.2345 USDT
📉 Profit Target Justification:
- The bullish target aligns with key Fibonacci retracement levels and a previous liquidity zone.
- The bearish target is supported by Fib extensions and the possibility of further downside if support breaks.
📌 Summary
✔ Price is at a key support level, suggesting a potential bullish move.
✔ Fibonacci confluence provides clear trade setups for both bullish and bearish scenarios.
✔ Risk-to-reward ratio is favorable in both directions.
🔻 Invalidation: If price breaks below 0.2320 USDT, bullish setups are invalid. Conversely, a strong move above 0.2345 USDT would invalidate bearish setups.
Disclaimer
The information and publications are not meant to be, and do not constitute, financial, investment, trading, or other types of advice or recommendations supplied or endorsed by TradingView. Read more in the Terms of Use.
Disclaimer
The information and publications are not meant to be, and do not constitute, financial, investment, trading, or other types of advice or recommendations supplied or endorsed by TradingView. Read more in the Terms of Use.