APHA Shape Looks Like a Flat
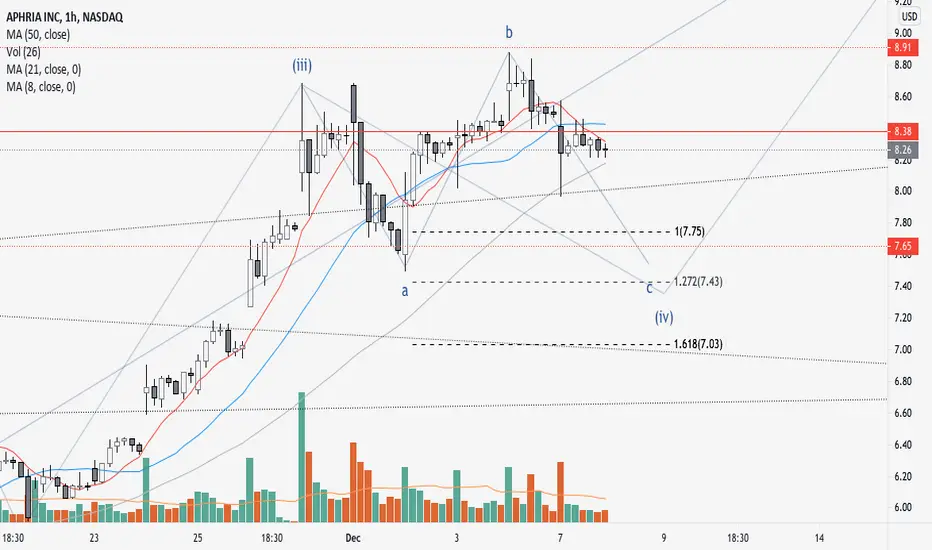
It has that 'flat correction' shape. Looking for direction here, with the price being squeezed between moving averages. If the hourly uptrend is lost, potential FIB targets for a healthy pull back are on the chart.
🅱🄰🆁🅺🆆🄾🆁🆃🅷
Disclaimer
The information and publications are not meant to be, and do not constitute, financial, investment, trading, or other types of advice or recommendations supplied or endorsed by TradingView. Read more in the Terms of Use.
🅱🄰🆁🅺🆆🄾🆁🆃🅷
Disclaimer
The information and publications are not meant to be, and do not constitute, financial, investment, trading, or other types of advice or recommendations supplied or endorsed by TradingView. Read more in the Terms of Use.