1. Trend and General Direction
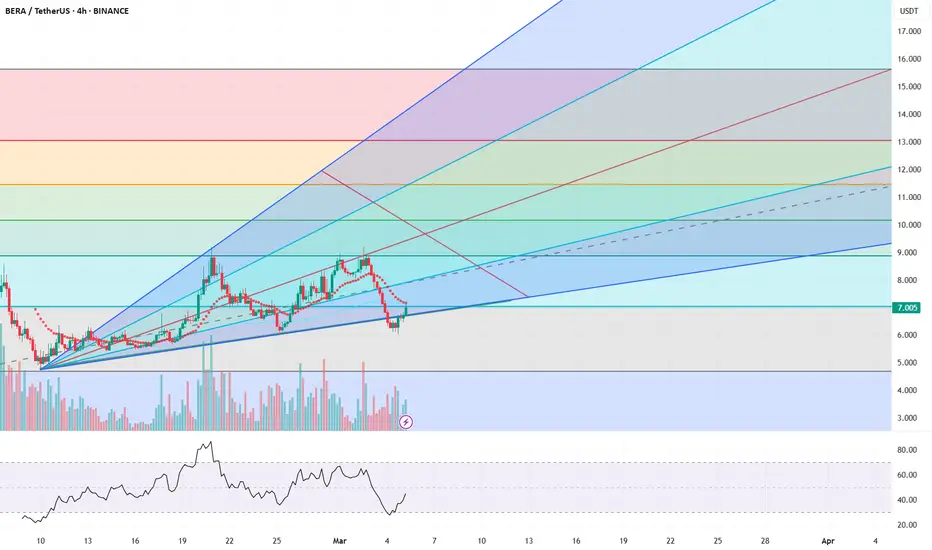
The price has been moving within an upward trend channel, but a recent pullback occurred.
Currently, the price is near the $7.035 level, which aligns with the 0.786 Fibonacci retracement level, acting as a strong support.
If this support holds, the next resistance levels are $8.871 (0.618 Fib) and $10.161 (0.5 Fib).
2. Fibonacci Levels and Key Zones
Support levels: $7.035 (0.786 Fibonacci level), $6.717 (previous low), $4.695 (1.0 Fib, extreme case).
Resistance levels: $8.871 (0.618 Fib), $10.161 (0.5 Fib), $11.451 (0.382 Fib), $13.047 (0.236 Fib).
3. RSI (Relative Strength Index)
The RSI indicator suggests that the price was recently in an oversold state and is now starting to recover.
If the RSI continues to rise, this could indicate a bullish continuation.
4. Gann Fan and Trendlines
The price found support around an ascending Gann fan line, which could act as a potential reversal point.
If the price breaks above key trendlines, the next targets could be in the $9–$10 range.
5. Summary and Outlook
✅ Bullish Scenario: If the price holds the $7.035 support and moves upward, the next targets will be $8.87–$10.16.
❌ Bearish Scenario: If the price breaks below this support, further downside could lead to $6.5 or even $5.
Recommendation: Keep an eye on the price movement in the coming days. If the price recovers above $7.5–$8, the uptrend is likely to continue.
Disclaimer
The information and publications are not meant to be, and do not constitute, financial, investment, trading, or other types of advice or recommendations supplied or endorsed by TradingView. Read more in the Terms of Use.
Disclaimer
The information and publications are not meant to be, and do not constitute, financial, investment, trading, or other types of advice or recommendations supplied or endorsed by TradingView. Read more in the Terms of Use.