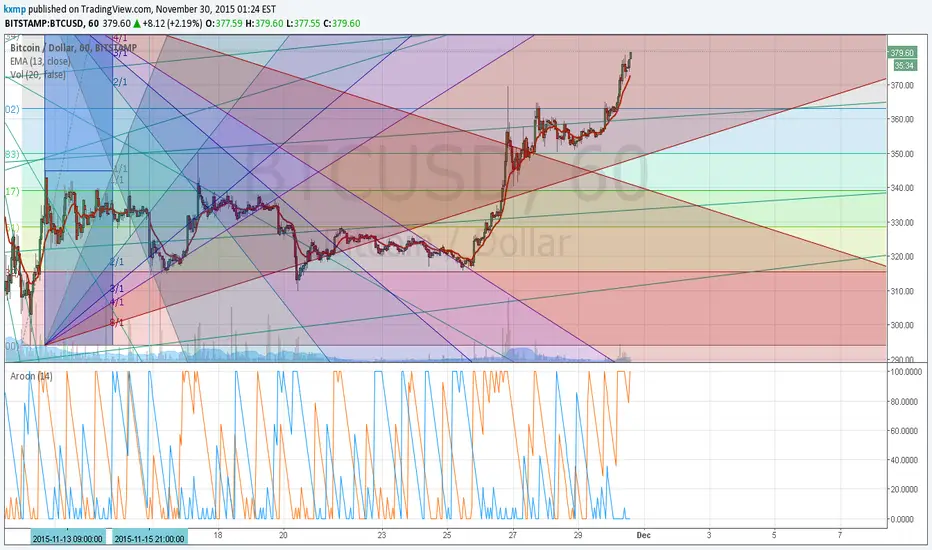
There are two Gann square.
The data I use is only 20151112 06:00 -- 2015111217:00
20151112 06:00 L294
1112 17:00 H344.78
diff=50.78 x10=507.8 x5=253.9
I used two 1x1 square [50.78] in hourly charts
The data I use is only 20151112 06:00 -- 2015111217:00
20151112 06:00 L294
1112 17:00 H344.78
diff=50.78 x10=507.8 x5=253.9
I used two 1x1 square [50.78] in hourly charts
Disclaimer
The information and publications are not meant to be, and do not constitute, financial, investment, trading, or other types of advice or recommendations supplied or endorsed by TradingView. Read more in the Terms of Use.
Disclaimer
The information and publications are not meant to be, and do not constitute, financial, investment, trading, or other types of advice or recommendations supplied or endorsed by TradingView. Read more in the Terms of Use.