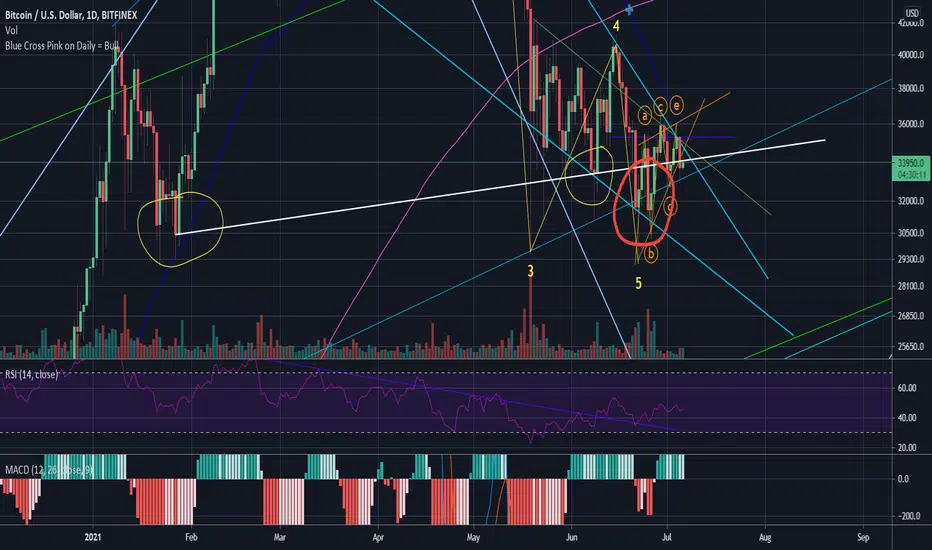
Okay, several people have replied to my analysis saying that the H+S neckline was not broken, but it was indeed broken. The neckline is taken as the bottom most solid daily candle of the neck (yellow circles), the neckline is the thick white line.
You can see that the neckline was broken in the red circle area (daily candle close below the neckline). The price rebounded above the neckline which is a common fake-out or dead-cat bounce or bull trap, and now we can see the price keeps wanting to retest the neckline.
This final test I think is the last before we plunge below the neckline to the $17k region to complete the H+S. This area also coincides with the weekly 200 SMA, several long-term trend lines dating back to 2008, is the end of Wave 4 (Wave 1 ended at 13K). So this is a strong rebound area to begin wave 5 up.
The H+S pattern is the most reliable pattern with an 85% reliability. No other pattern has greater than 80% reliability. All the convergences of powerful patterns at the $17k region is very convincing, and so far I am not convinced by any other less reliable pattern that indicates that we have started Wave 5.
You can see on the smaller time-scale today (eg. the 4 hourly), that we are really struggling now to go above the neckline. The 4 hourly MACD has reversed the curve indicating more bearishness for the next 12 hours or so, which would mean a daily close (again) below the neckline - all these bearish signals to me indicate a high probability of a major plunge that won't go back to $35k until we complete the Wave 4 and the H+S.
It is super important for swing trading to sell at this stage, so that one can double one's profits when we hit $17k, and also make the rebound much stronger at the $17k region.
You can see that the neckline was broken in the red circle area (daily candle close below the neckline). The price rebounded above the neckline which is a common fake-out or dead-cat bounce or bull trap, and now we can see the price keeps wanting to retest the neckline.
This final test I think is the last before we plunge below the neckline to the $17k region to complete the H+S. This area also coincides with the weekly 200 SMA, several long-term trend lines dating back to 2008, is the end of Wave 4 (Wave 1 ended at
The H+S pattern is the most reliable pattern with an 85% reliability. No other pattern has greater than 80% reliability. All the convergences of powerful patterns at the $17k region is very convincing, and so far I am not convinced by any other less reliable pattern that indicates that we have started Wave 5.
You can see on the smaller time-scale today (eg. the 4 hourly), that we are really struggling now to go above the neckline. The 4 hourly MACD has reversed the curve indicating more bearishness for the next 12 hours or so, which would mean a daily close (again) below the neckline - all these bearish signals to me indicate a high probability of a major plunge that won't go back to $35k until we complete the Wave 4 and the H+S.
It is super important for swing trading to sell at this stage, so that one can double one's profits when we hit $17k, and also make the rebound much stronger at the $17k region.
Disclaimer
The information and publications are not meant to be, and do not constitute, financial, investment, trading, or other types of advice or recommendations supplied or endorsed by TradingView. Read more in the Terms of Use.
Disclaimer
The information and publications are not meant to be, and do not constitute, financial, investment, trading, or other types of advice or recommendations supplied or endorsed by TradingView. Read more in the Terms of Use.
