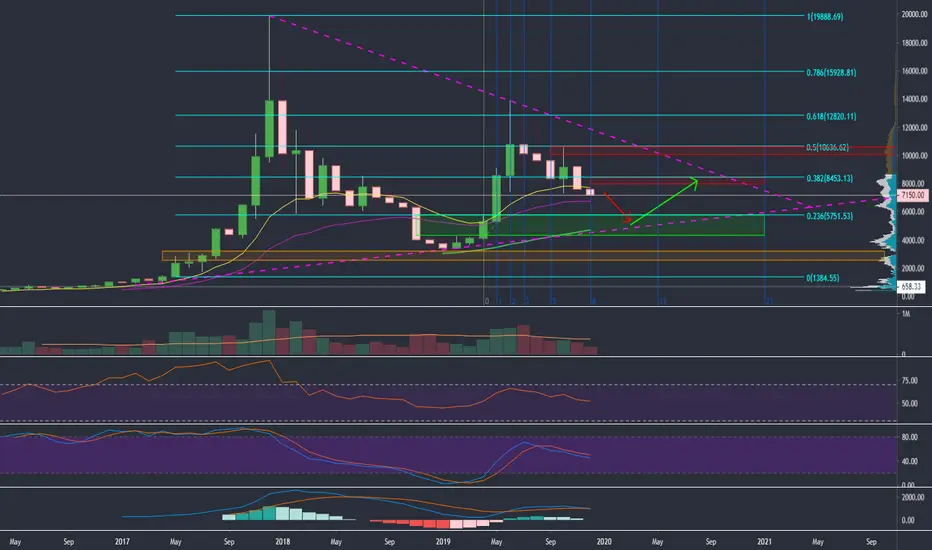
Looks like BTC finally broke it's Monthly 12 EMA(yellow) and pierced through 26 EMA(purple) with a wick. 26 EMA seems to be holding as support for now. Monthly MACD seems to be forming a bearish crossover. We are showing similarities to the beginning downtrend from 2017-2018. I found a Fib Retracement(Light blue) that BTC seems to respect in the past and as of now. At 5.7k @ .236 of our Fib retracement, we held support for the 2017-2018. Will this again be a significant level? But at this level, we are below our EMA's so it might not be as strong as it was but a good possibility we get a bounce there to test our 26 EMA (purple) as resistance. There we can confirm a shift in Monthly momentum.
How far down can we go?
BTC is forming a huge triangle marked by pink dotted lines. At the bottom of our triangle is also lining up with our 50 SMA (green). The 50 SMA acted as support for 2019's bullrun, so I think there's a high possibility we will go for a bottom test there again. So we could have a bottom near our green rectangle. If green rectangle doesn't hold we could be looking at 2-3k area for next support but I suspect a low chance of that happening.
Note
After another bounce from 6500, we are holding well for 7k. The market did not fall like I predicted, but we are not in the clear just yet. Although we did however manage to get back above our 200SMA (red) on the 4HR chart and make support, this is only the first time it's testing as support. As long as the market continue to hold above the 200 SMA, we could go to test around 7800-8000 levels. marked by red rectangle.
Note
Going to our 1Daily, we have managed to get above our EMA's(yellow/purple). They are starting to curve up for a momentum switch. But we are not out of the woods until can break above our 50 SMA(green) which acted as resistance as of recently and our 100 SMA(yellow) which is almost near our 0.5 fib retracement. I suspect that we will be ranging between our 0.382 and 0.5 of the yellow fib retracement. We will be more clearer in which direction BTC takes when either of those level break.
Note
1D update
After breaking out of our 50 SMA we almost made it all the way to our .5 yellow fib retrace and found resistance. We are still within our .5 fib and .382 retracement levels. And as of right now, we have our 100 SMA(orange) holding as resistance. If we fail to get above our 100 SMA, then we'd probably go back down to test .382 of our fib retracement. On the other hand, we have a bullish EMA(yellow/purple) crossover and prices found support on our 12 EMA(yellow). If we continue to hold above our EMA's and break through 100 SMA, then that would give me more confidence that we will go to test our 200 SMA(red) near 9k - 9.2k
Note
1D Update
After holding above our EMA's(yellow/purple) and also our 100 SMA(orange), we had more upwards momentum that brought us to closer to test our 200 SMA(red). We broke through our 0.5 fib retrace and is holding support there at the moment. We had a 30% runup from our recent lows of 6800. It seems like a nice run up indeed and things look to be very positive but I am skeptical. I will remain skeptical untill we break not only the 200 SMA to the upside, but also break our resistance levels of 9.5k - 10k. Only then will I be confident of trend reversal, as of now this looks like a bull trap.
Note
On the other hand! This is 1D BTCUSDSHORTS on BitfinexWe can see multiple short squeezes, most recent ones on the 100 SMA (orange). I highly suspect that we could get another short squeeze again soon. If so, I believe it could be enough to break us out of our resistance on BTC but it'll be manipulation and not actual liquidity coming in.
Note
Disclaimer
The information and publications are not meant to be, and do not constitute, financial, investment, trading, or other types of advice or recommendations supplied or endorsed by TradingView. Read more in the Terms of Use.
Disclaimer
The information and publications are not meant to be, and do not constitute, financial, investment, trading, or other types of advice or recommendations supplied or endorsed by TradingView. Read more in the Terms of Use.