* Just an update, nothing new added to the chart except RSI from last update*
This idea was also made before the Daily close on March 17 2021.
Last idea link:

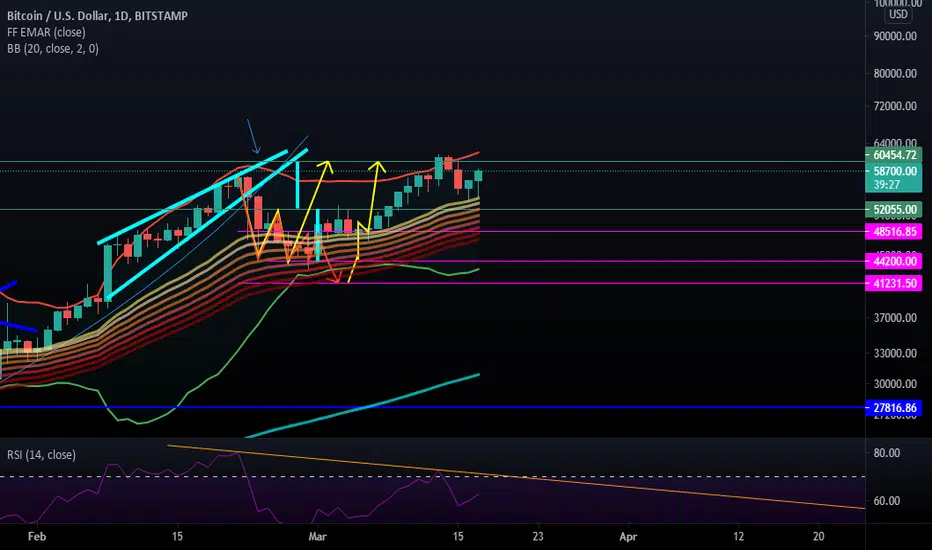
Hello guys, bringing you guys another update with some good and bad news! Let's start with the good news, it looks like we have one last push to the upside with the bad news being Bitcoin is close to running out of steam in the short term.
Let's get into the facts.
It looks like on the Daily RSI bitcoin is showing a bearish divergence with higher lows while the price has continued higher. We have push 1 which was on Jan 8th 2021 (88), the second push being Feb 21st 2021 (79), and now the third push was over the past weekend on March 13 2021 (didn't reach the top) which then gave us my exact price target I had from a previous idea on Feb 26th.
Now let's keep in mind, our Monthly RSI is showing 91.73 while any other bull market has topped out at 95 or 96 on the Monthly RSI. Does this mean Bitcoin bull run is coming to an end? I would have to say no because it's way different this time around. I would expect a correction or range to happen after this next push. My bullish price target is between 70-77k in the short term while my bearish price target is 45k lowest due to the high accumulation level around that price level.
Indicators:
EMA Ribbons
BB 20
RSI
like, leave some feedback, and follow for future updates
Happy trading! :D
This idea was also made before the Daily close on March 17 2021.
Last idea link:
Hello guys, bringing you guys another update with some good and bad news! Let's start with the good news, it looks like we have one last push to the upside with the bad news being Bitcoin is close to running out of steam in the short term.
Let's get into the facts.
It looks like on the Daily RSI bitcoin is showing a bearish divergence with higher lows while the price has continued higher. We have push 1 which was on Jan 8th 2021 (88), the second push being Feb 21st 2021 (79), and now the third push was over the past weekend on March 13 2021 (didn't reach the top) which then gave us my exact price target I had from a previous idea on Feb 26th.
Now let's keep in mind, our Monthly RSI is showing 91.73 while any other bull market has topped out at 95 or 96 on the Monthly RSI. Does this mean Bitcoin bull run is coming to an end? I would have to say no because it's way different this time around. I would expect a correction or range to happen after this next push. My bullish price target is between 70-77k in the short term while my bearish price target is 45k lowest due to the high accumulation level around that price level.
Indicators:
EMA Ribbons
BB 20
RSI
like, leave some feedback, and follow for future updates
Happy trading! :D
Disclaimer
The information and publications are not meant to be, and do not constitute, financial, investment, trading, or other types of advice or recommendations supplied or endorsed by TradingView. Read more in the Terms of Use.
Disclaimer
The information and publications are not meant to be, and do not constitute, financial, investment, trading, or other types of advice or recommendations supplied or endorsed by TradingView. Read more in the Terms of Use.