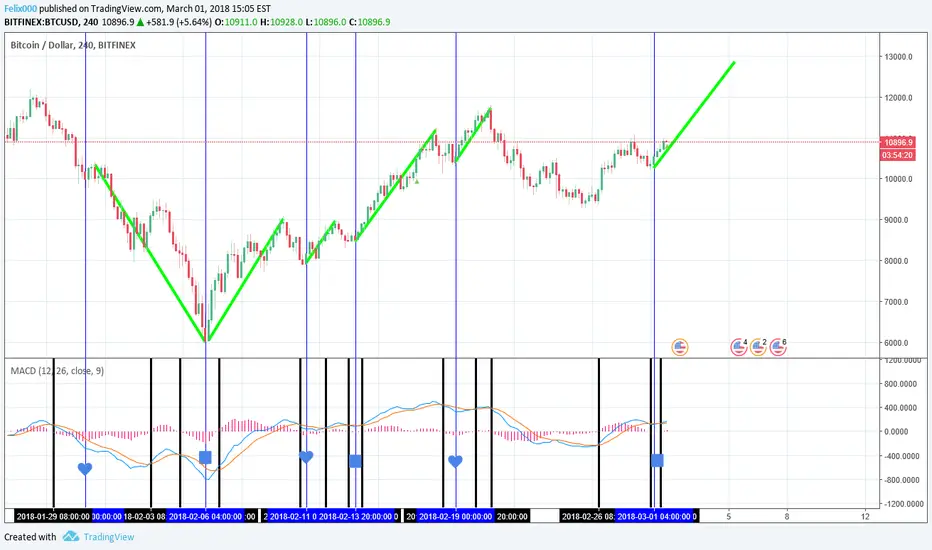
I thought there were just MACD patterns in the 2 hour chart but have found them same in 4 hour chart worth a punt with stops
Note
Looking back at the previous patterns the low at the start of the run should hold. Also on the 2 hour chart the market may head down for that MACD to line up with what's already been indicated on the 4 hour MACD. It needs a cross over down followed by a first trough in the MACD (which may include the cross over I haven't back checked) and that first trough must remain the lowest trough until the market crosses back up again (the set up).Note
If market takes off up there is no guarantee it will reach or surpass the end of the green projection! I purely based it on two previous runs.Note
Williams Fractal. A word of caution. I've just completed some research and it does not appear to be a good sign when you spot two Williams arrows in the same direction at least 12 bars apart. Within maybe a day or several days later the price is back and can even go the other way. I only checked this going back to December 2018. Best check it yourselves. But thought to let you know just in case.Note
Rise in 4 hour MACD has looked unusually weak.Disclaimer
The information and publications are not meant to be, and do not constitute, financial, investment, trading, or other types of advice or recommendations supplied or endorsed by TradingView. Read more in the Terms of Use.
Disclaimer
The information and publications are not meant to be, and do not constitute, financial, investment, trading, or other types of advice or recommendations supplied or endorsed by TradingView. Read more in the Terms of Use.