This chart for BTC/USD (30-minute timeframe) is showing a classic ascending triangle pattern, which is typically a bullish formation.
Breakdown:
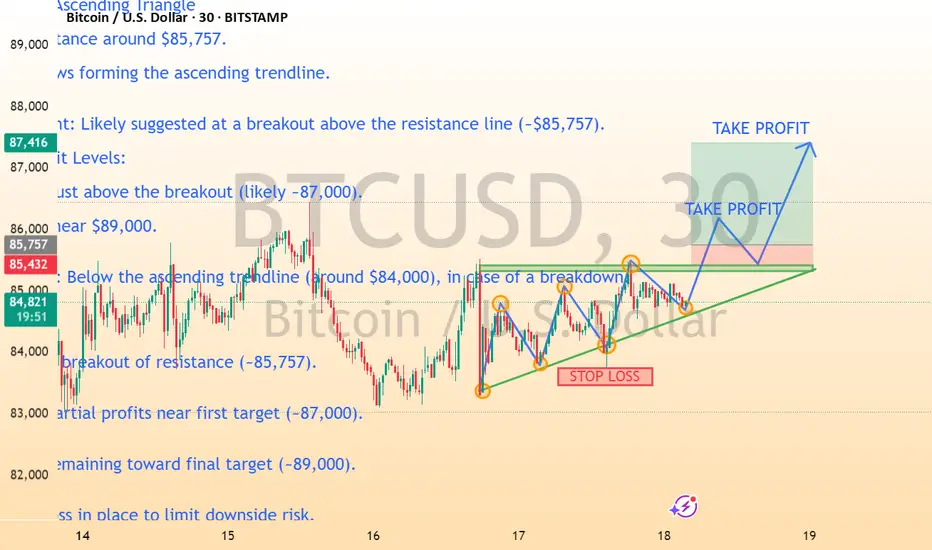
Pattern: Ascending Triangle
Flat resistance around $85,757.
Higher lows forming the ascending trendline.
Entry Point: Likely suggested at a breakout above the resistance line (~$85,757).
Take Profit Levels:
First TP just above the breakout (likely ~87,000).
Final TP near $89,000.
Stop Loss: Below the ascending trendline (around $84,000), in case of a breakdown.
Strategy:
1. Buy on breakout of resistance (~85,757).
2. Take partial profits near first target (~87,000).
3. Hold remaining toward final target (~89,000).
4. Stop loss in place to limit downside risk.
Would you like a technical explanation of why this pattern is considered bullish or how to trade it more conservatively?
Breakdown:
Pattern: Ascending Triangle
Flat resistance around $85,757.
Higher lows forming the ascending trendline.
Entry Point: Likely suggested at a breakout above the resistance line (~$85,757).
Take Profit Levels:
First TP just above the breakout (likely ~87,000).
Final TP near $89,000.
Stop Loss: Below the ascending trendline (around $84,000), in case of a breakdown.
Strategy:
1. Buy on breakout of resistance (~85,757).
2. Take partial profits near first target (~87,000).
3. Hold remaining toward final target (~89,000).
4. Stop loss in place to limit downside risk.
Would you like a technical explanation of why this pattern is considered bullish or how to trade it more conservatively?
Trade active
ACTIVE TRADE📲 Join telegram channel free ..
t.me/Money_Magnet08
Forex, Gold & Crypto Signals with detailed analysis & get consistent results..
t.me/Money_Magnet08
Gold Signal's with proper TP & SL for high profit opportunities..
t.me/Money_Magnet08
Forex, Gold & Crypto Signals with detailed analysis & get consistent results..
t.me/Money_Magnet08
Gold Signal's with proper TP & SL for high profit opportunities..
Disclaimer
The information and publications are not meant to be, and do not constitute, financial, investment, trading, or other types of advice or recommendations supplied or endorsed by TradingView. Read more in the Terms of Use.
📲 Join telegram channel free ..
t.me/Money_Magnet08
Forex, Gold & Crypto Signals with detailed analysis & get consistent results..
t.me/Money_Magnet08
Gold Signal's with proper TP & SL for high profit opportunities..
t.me/Money_Magnet08
Forex, Gold & Crypto Signals with detailed analysis & get consistent results..
t.me/Money_Magnet08
Gold Signal's with proper TP & SL for high profit opportunities..
Disclaimer
The information and publications are not meant to be, and do not constitute, financial, investment, trading, or other types of advice or recommendations supplied or endorsed by TradingView. Read more in the Terms of Use.