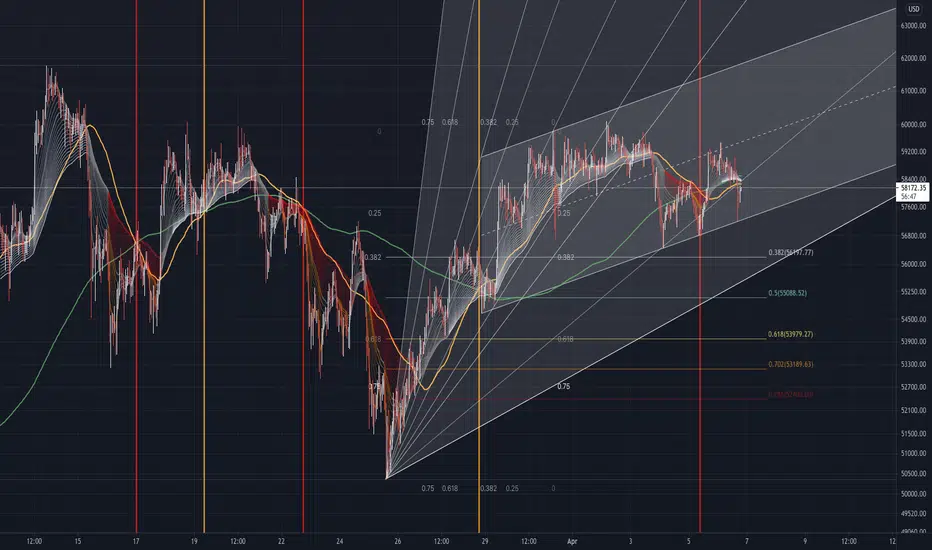
Okay. I'm trying to falsify the head and shoulders plus inverse head and shoulders combination I posted (linked below) that would suggest a near move by BTC down to 54.4.
This the best I can currently come up with to suggest no major move to the downside, but rather a slow continuation to 64 and beyond in the near term.
A few things to note about this chart:
1) Note the death cross on the far left. The 200 and 100 EMAs were previously very divergent. So this death cross comes in late. The downward move had already happened.
2) The second death cross, in the middle, appears before the major downside impulse. The 200 and 100 EMAs were close together, cross and diverge, which represents the force of the downside impulse.
3) We should remember that these EMAs follow price. What happens in the market is mirrored in these indicators. They have some predictive use, but divergence is where the market does something else than they would otherwise suggest.
4) It's notable how the 200 EMA aligns nicely with the bottom of the channel that can be drawn now we have three taps of its lower line. This does suggest that a channel is indeed an appropriate way of thinking about where BTC is right now.
5) The base of the channel would represent strong support. Not immutable, but strong nonetheless.
6) The most recent death cross comes in as the 200 and 100 EMA lines are close together. If BTC is indeed at the bottom of an ascending channel, there is perhaps no reason to think that this death cross suggests a strong move to the downside coming, as the base of the channel will act as strong local support. We could soon see a golden cross and these lines diverge to allow an upswing.
7) The Fibonacci fans are useful to track the bounce into the channel. It's noticeable how useful this tool can be.
8) The one thing I don't understand perhaps rests on the difference between a bounce and an impulse. With an impulse, we expect a correction (usually to the 0.618, or 0.786 of the Fibonacci taken on the impulse leg). But with a bounce off resistance (here, at 50k, on 25 March, and which was a 0.618 correction), can we think of what followed as an impulse? Should we expect a correction? Or will the base of the channel hold?
Please comment.
Note
You could also see this a bounce off the midline of a wider ascending channelNote
07 Apr 2021 11:52:23:Too far, in my view, to assume that the midline of the channel — if even a channel is valid — will hold as support. Puts the H&S pattern within a larger inverse H&S formation back in view, with a possible downside target of 54.4k in the next couple of days.Note
07 Apr 2021 13:41:20: This is what I'm currently seeing. If you're long and affected, try to hold to the bounce, and I would consider exiting at the 0.618 on the BTC chart. I expect a further downside reach on BTC's partAgitationZone | TA-focused cryptocurrency Discord channel discord.gg/atGcaRzz
Related publications
Disclaimer
The information and publications are not meant to be, and do not constitute, financial, investment, trading, or other types of advice or recommendations supplied or endorsed by TradingView. Read more in the Terms of Use.
AgitationZone | TA-focused cryptocurrency Discord channel discord.gg/atGcaRzz
Related publications
Disclaimer
The information and publications are not meant to be, and do not constitute, financial, investment, trading, or other types of advice or recommendations supplied or endorsed by TradingView. Read more in the Terms of Use.