My previous idea was wrong... I admit now! But...
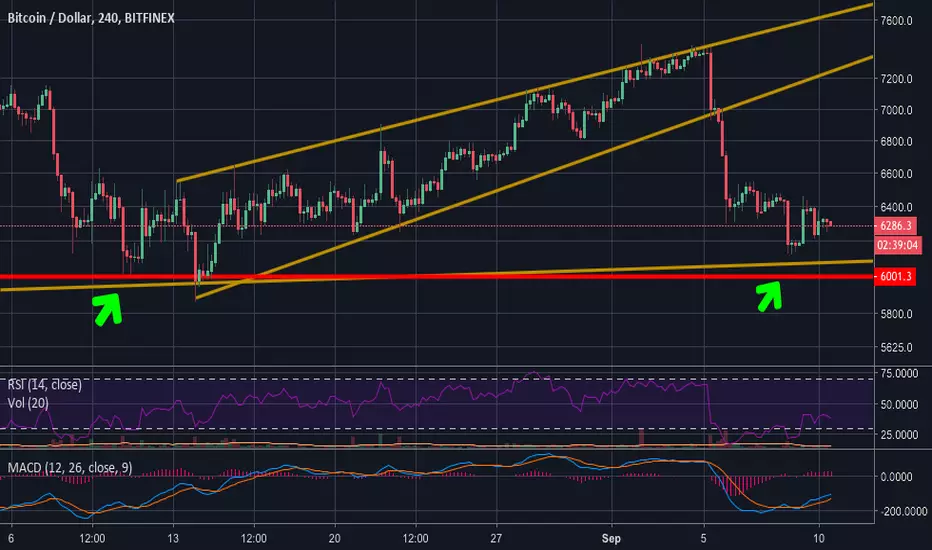
At this 4 h chart we can see, two green arrows, where I think, it is looking really really similar.
It happened in August already, of course it doesn't mean it will happen now in September too... But some indicators like RSI showing bullish divergence and the candy pattern is showing similarities. So I think this could be a possible entry for long. Not right now, but around 6100 areas, because in August 18 we had a third leg down before the reversal up/sideways.
I am neutral at the moment, but in the next 24-48 h I can evaluate better.
Happy trading!
*This is not an financial advice, this is only an idea. Do your own research and act on your responsibility.
Disclaimer
The information and publications are not meant to be, and do not constitute, financial, investment, trading, or other types of advice or recommendations supplied or endorsed by TradingView. Read more in the Terms of Use.
Disclaimer
The information and publications are not meant to be, and do not constitute, financial, investment, trading, or other types of advice or recommendations supplied or endorsed by TradingView. Read more in the Terms of Use.