Well, what a ride BTC is having. From the highs before the dump in early March to the lows of the dump where many investors got wrecked. With more uncertainty in this ever changing world we live in due to a world pandemic and economic crisis, where is BTC heading?
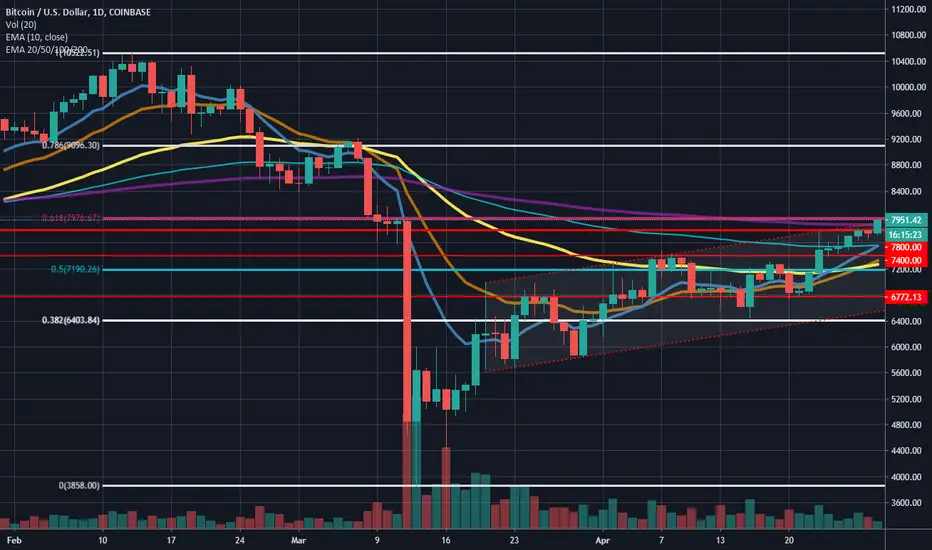
Looking at the daily chart we can see BTC has made a huge recovery from the dump. It is trying to break out of the Gaussian Channel and above the red horizontal line at $7800 which is resistance. It has a few hurdles though to go higher, being these 2 indicators above plus the EMA 200 (in purple) and the 0.618 fib level at $7976 and the rising channel shown by the red dotted lines it is currently trading in. If BTC can break and close above all these indicators then the halving pump will continue and $8500 will be in plain view.
On the other hand, if we get a lot of resistance at these levels mentioned then BTC could dump to $6400 or lower in another crash type scenario. I find the way down is alot easier to break through support levels than trying to break through resistance levels on the way up. What we have to bear in mind here is the 6+ weeks in a row of green candles. The 10000+ BTC sent to a hot wallet from an exchange that allegedly trades against its clientele. The ever increasing talk of every trader about this is the moment BTC blasts off to the moon as the halving is here. Usually when everything looks too perfect in BTC, it goes the other way, could this be that time?
On the weekly chart below the MACD is about to form a bullish crossover but hasn't confirmed this yet. The EMA 10 (in blue) is still under the MA 21 (in orange) which is bearish, but on the other hand, BTC is now trading above the MA 21 (which is bullish) but is yet to confirm this.

On the 3hour chart below we can see the rising wedge shown by the green dotted lines. This is bearish but may be a false signal as it is above the 0.5 fib retrace level.

The charts tell us everything is more bullish than bearish when you weigh up the facts, so why go short? Well, for the reason everyone is long and buying so the whale cartel will do the opposite as they want your hard earned money. Plus, that wedge formation looks like at the 8k level would be a great time to open a short and as always if things don't go as planned, have a plan b and c ready to go.
Plan A: I am taking a short position at the 0.618 fib level @ $7976 in anticipation of a pre-halving crash dump by the whale cartel. Use a stop loss incase the whales decide to go with the flow for a change and pump BTC in a frenzy.
Plan B: If stop loss activates have it buy up BTC on a long position at the same time.
Plan C: If Plan B activates and then BTC dumps before hitiing 8.5k, have a stop loss in place and cop 2 bad trades in a row with a slap in the face!
Happy trading legends!
HTBB
Looking at the daily chart we can see BTC has made a huge recovery from the dump. It is trying to break out of the Gaussian Channel and above the red horizontal line at $7800 which is resistance. It has a few hurdles though to go higher, being these 2 indicators above plus the EMA 200 (in purple) and the 0.618 fib level at $7976 and the rising channel shown by the red dotted lines it is currently trading in. If BTC can break and close above all these indicators then the halving pump will continue and $8500 will be in plain view.
On the other hand, if we get a lot of resistance at these levels mentioned then BTC could dump to $6400 or lower in another crash type scenario. I find the way down is alot easier to break through support levels than trying to break through resistance levels on the way up. What we have to bear in mind here is the 6+ weeks in a row of green candles. The 10000+ BTC sent to a hot wallet from an exchange that allegedly trades against its clientele. The ever increasing talk of every trader about this is the moment BTC blasts off to the moon as the halving is here. Usually when everything looks too perfect in BTC, it goes the other way, could this be that time?
On the weekly chart below the MACD is about to form a bullish crossover but hasn't confirmed this yet. The EMA 10 (in blue) is still under the MA 21 (in orange) which is bearish, but on the other hand, BTC is now trading above the MA 21 (which is bullish) but is yet to confirm this.
On the 3hour chart below we can see the rising wedge shown by the green dotted lines. This is bearish but may be a false signal as it is above the 0.5 fib retrace level.
The charts tell us everything is more bullish than bearish when you weigh up the facts, so why go short? Well, for the reason everyone is long and buying so the whale cartel will do the opposite as they want your hard earned money. Plus, that wedge formation looks like at the 8k level would be a great time to open a short and as always if things don't go as planned, have a plan b and c ready to go.
Plan A: I am taking a short position at the 0.618 fib level @ $7976 in anticipation of a pre-halving crash dump by the whale cartel. Use a stop loss incase the whales decide to go with the flow for a change and pump BTC in a frenzy.
Plan B: If stop loss activates have it buy up BTC on a long position at the same time.
Plan C: If Plan B activates and then BTC dumps before hitiing 8.5k, have a stop loss in place and cop 2 bad trades in a row with a slap in the face!
Happy trading legends!
HTBB
Trade active
went to get dinner and BAM! stop loss hit and now long @ $8060
Note
Luckily we have back up plans when plan A fails. If you fail to plan you plan to fail.Is BTC about to pump to 10k?
Trade closed manually
BTC broke the EMA 100 on 1 hour chart and will move to the MA 200 or below it. Closed trade and gone short @ $8720Disclaimer
The information and publications are not meant to be, and do not constitute, financial, investment, trading, or other types of advice or recommendations supplied or endorsed by TradingView. Read more in the Terms of Use.
Disclaimer
The information and publications are not meant to be, and do not constitute, financial, investment, trading, or other types of advice or recommendations supplied or endorsed by TradingView. Read more in the Terms of Use.