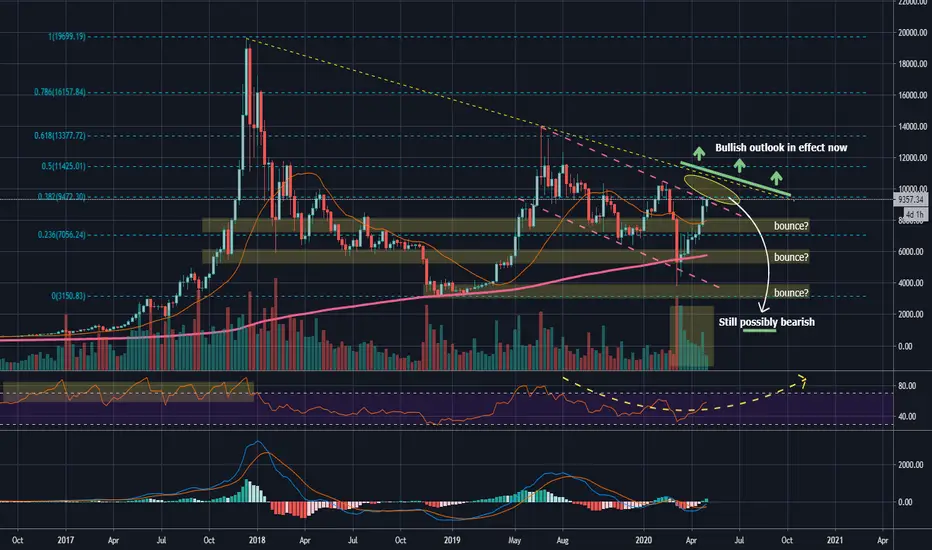
Macro chart - BTC
RSI not in bullish control zone yet, as of now i still see an overall bearish chart and trend.
Currently at a critical point - .382 fib level and top resistance of downward channel (Pink).
Breakout above would negate the pink channel. A further breakout above the yellow circle above pretty much negates the entire downward trend line that began after $20k all time high.
Trade active
As I suspected we have gotten a nice pullback, large enough for me to close my short at approximately 8.1k before it creeped back up.
Now we're not obviously going to pull back fully that fast, things take time. We could still be bullish on the short time frame and this could be a shakeout. Overall I am still short bias on longer time frames and looking to see lower prices overall in the future.
Trade safely, cheers.
Disclaimer
The information and publications are not meant to be, and do not constitute, financial, investment, trading, or other types of advice or recommendations supplied or endorsed by TradingView. Read more in the Terms of Use.
Disclaimer
The information and publications are not meant to be, and do not constitute, financial, investment, trading, or other types of advice or recommendations supplied or endorsed by TradingView. Read more in the Terms of Use.