Technical and Statistical Time-Series Analysis for Bitcoin (BTC)

Technical and Statistical Time-Series Analysis for Bitcoin (BTC) 📈
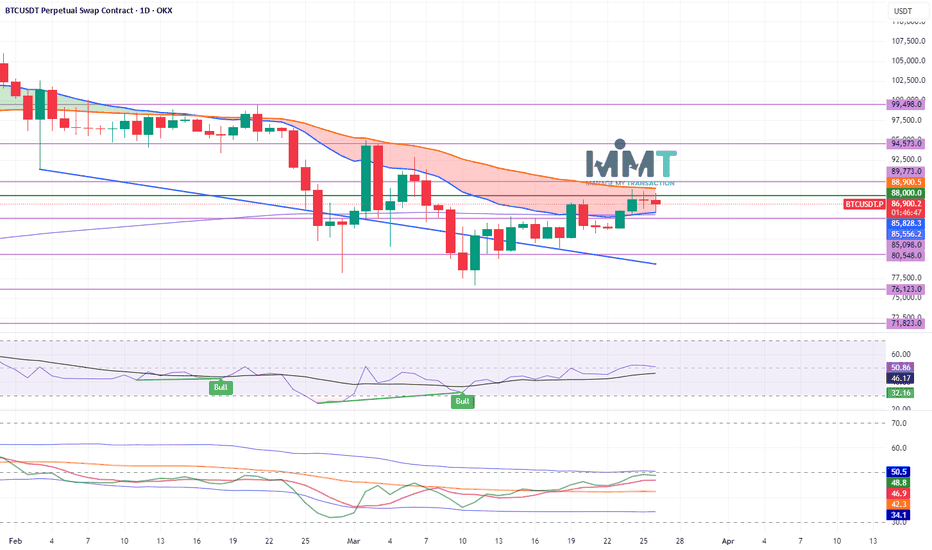
Bitcoin is currently trading around $82,000, having breached the critical support level at $80,548. This breakdown, combined with a potential daily close below this level, indicates a likelihood of accelerated downward momentum towards the corrective cycle's end target of $71,823. This target is anticipated to be reached within a short timeframe, between April 9th and 11th.
Price Movement Predictions: 🔮
March 30th - 31st:
A price rebound from $80,548 to $85,098 is expected, serving as a retest. Any rejection from the $85,098 range will signal a continuation of the corrective downtrend. 📉
March 31st - April 10th:
Continuation of the downward cycle is anticipated, targeting the following levels:
First Target: $76,123 🎯
Second Target: $71,823 🎯
April 11th or 12th:
A potential trend reversal towards a strong uptrend is foreseen. 🚀
Invalidation of the Scenario: ⚠️
This scenario will be invalidated if the price breaks above and closes above $90,000. This breakout and close, especially if sustained for three consecutive days, would signal the end of the correction and the resumption of the uptrend towards a new peak. 🔝
Notes: 📝
These predictions are based on technical analysis and do not constitute investment advice. 🚫
The cryptocurrency market is highly volatile, and trading involves significant risk. Proceed with caution. 🚨
It is very important to pay close attention to the economic market news, that can change any technical analysis. 📰
Trade active
You can See Previous Post to Understand what is going on now See Previous Post 👇🏻👇🏻👇🏻👇🏻👇🏻👇🏻
Disclaimer
The information and publications are not meant to be, and do not constitute, financial, investment, trading, or other types of advice or recommendations supplied or endorsed by TradingView. Read more in the Terms of Use.
Disclaimer
The information and publications are not meant to be, and do not constitute, financial, investment, trading, or other types of advice or recommendations supplied or endorsed by TradingView. Read more in the Terms of Use.