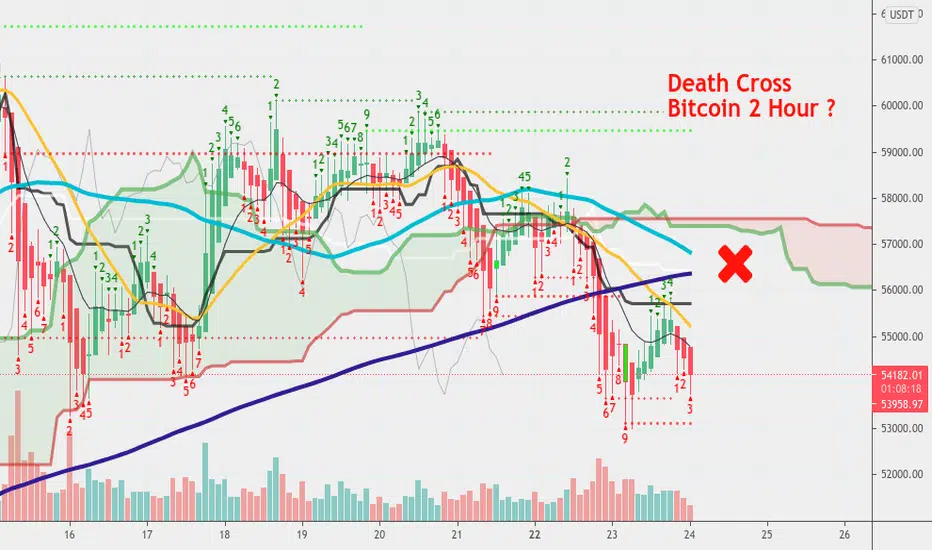
Here we see our Bitcoin 2 hour chart . Can you see that red X on the chart ? Well, X marks the spot where we may see a Death Cross happening
very soon . A Death Cross is when our light blue 50 MA crosses down and through our dark blue 200 MA . This should bring downward price movement. It's a very bearish event - though keep in mind this is the 2 hour chart . While it's hard to know how low this can go it wouldn't be impossible for Bitcoin to actually go sub 50k here . Please understand we are still long-term bullish for the rest of the year even if we see more pullback on Bitcoin. This will also be great for altcoins which could see a little altseason starting soon.
very soon . A Death Cross is when our light blue 50 MA crosses down and through our dark blue 200 MA . This should bring downward price movement. It's a very bearish event - though keep in mind this is the 2 hour chart . While it's hard to know how low this can go it wouldn't be impossible for Bitcoin to actually go sub 50k here . Please understand we are still long-term bullish for the rest of the year even if we see more pullback on Bitcoin. This will also be great for altcoins which could see a little altseason starting soon.
😃 Join shimmeringpath's friendly free
Telegram chat here : bulls and bears both welcome !
t.me/CryptoRisingTradersChat
Telegram chat here : bulls and bears both welcome !
t.me/CryptoRisingTradersChat
Disclaimer
The information and publications are not meant to be, and do not constitute, financial, investment, trading, or other types of advice or recommendations supplied or endorsed by TradingView. Read more in the Terms of Use.
