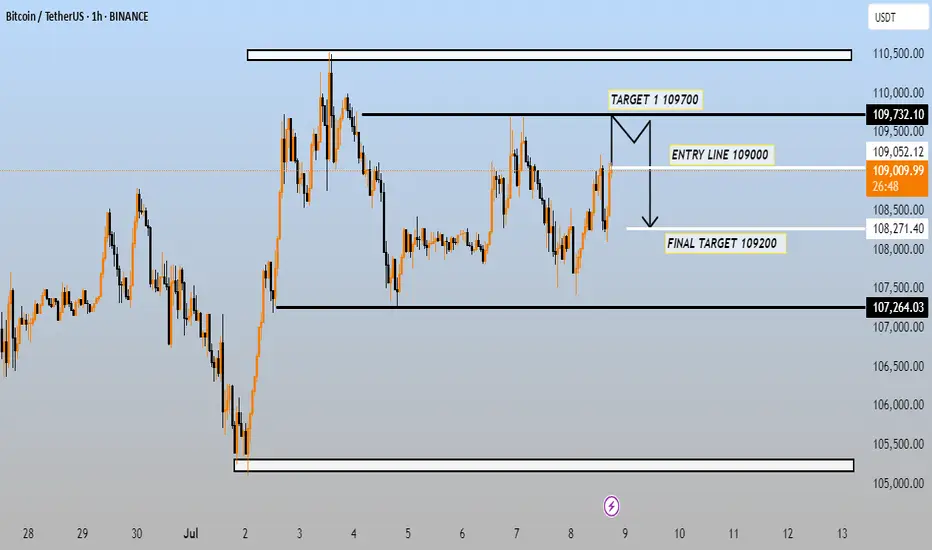
This chart shows a short-term trading setup for Bitcoin (BTC/USDT) on the 1-hour timeframe, with levels and strategy outlined clearly. Here's a breakdown of the trading idea:
---
⚙ Trade Setup Overview:
Pair: BTC/USDT
Timeframe: 1H (1-hour candles)
Exchange: Binance
Current Price: ~109,076.91 USDT
---
📈 Key Levels:
Entry Line: 109,000
Target 1: 109,700 (Upside move)
Final Target: 109,200 (Downside move)
Support Zone: ~107,264.03
Resistance Zone: ~109,732.10
---
🔁 Strategy Interpretation:
Possible scenario:
Price is expected to spike up slightly toward 109,700 (Target 1) — a liquidity grab or false breakout scenario.
Then, a short trade (sell) is anticipated at or near 109,700, targeting 109,200 as the final move downward.
Visual Cue: The "M" pattern on the chart suggests a double top or liquidity sweep, often used in smart money concepts.
---
📌 Conclusion:
The idea is to:
Enter short around 109,700
Initial stop loss likely above 109,732.10
Take profit at 109,200, possibly trailing toward 108,271.40 or further down to the broader support at 107,264.03 if momentum continues.
Let me know if you want a risk-reward calculation, SL/TP planning, or this strategy translated into a script.
---
⚙ Trade Setup Overview:
Pair: BTC/USDT
Timeframe: 1H (1-hour candles)
Exchange: Binance
Current Price: ~109,076.91 USDT
---
📈 Key Levels:
Entry Line: 109,000
Target 1: 109,700 (Upside move)
Final Target: 109,200 (Downside move)
Support Zone: ~107,264.03
Resistance Zone: ~109,732.10
---
🔁 Strategy Interpretation:
Possible scenario:
Price is expected to spike up slightly toward 109,700 (Target 1) — a liquidity grab or false breakout scenario.
Then, a short trade (sell) is anticipated at or near 109,700, targeting 109,200 as the final move downward.
Visual Cue: The "M" pattern on the chart suggests a double top or liquidity sweep, often used in smart money concepts.
---
📌 Conclusion:
The idea is to:
Enter short around 109,700
Initial stop loss likely above 109,732.10
Take profit at 109,200, possibly trailing toward 108,271.40 or further down to the broader support at 107,264.03 if momentum continues.
Let me know if you want a risk-reward calculation, SL/TP planning, or this strategy translated into a script.
Trade active
TARGET 1 DONEJoin telegram free...
t.me/+16bIVCNBo0MzYzk0
Forex Gold & Crypto Signals with
detailed analysis & get consistent |
result ...
Gold Signals with peoper TP & SL for
high profit ...
t.me/+16bIVCNBo0MzYzk0
t.me/+16bIVCNBo0MzYzk0
Forex Gold & Crypto Signals with
detailed analysis & get consistent |
result ...
Gold Signals with peoper TP & SL for
high profit ...
t.me/+16bIVCNBo0MzYzk0
Disclaimer
The information and publications are not meant to be, and do not constitute, financial, investment, trading, or other types of advice or recommendations supplied or endorsed by TradingView. Read more in the Terms of Use.
Join telegram free...
t.me/+16bIVCNBo0MzYzk0
Forex Gold & Crypto Signals with
detailed analysis & get consistent |
result ...
Gold Signals with peoper TP & SL for
high profit ...
t.me/+16bIVCNBo0MzYzk0
t.me/+16bIVCNBo0MzYzk0
Forex Gold & Crypto Signals with
detailed analysis & get consistent |
result ...
Gold Signals with peoper TP & SL for
high profit ...
t.me/+16bIVCNBo0MzYzk0
Disclaimer
The information and publications are not meant to be, and do not constitute, financial, investment, trading, or other types of advice or recommendations supplied or endorsed by TradingView. Read more in the Terms of Use.