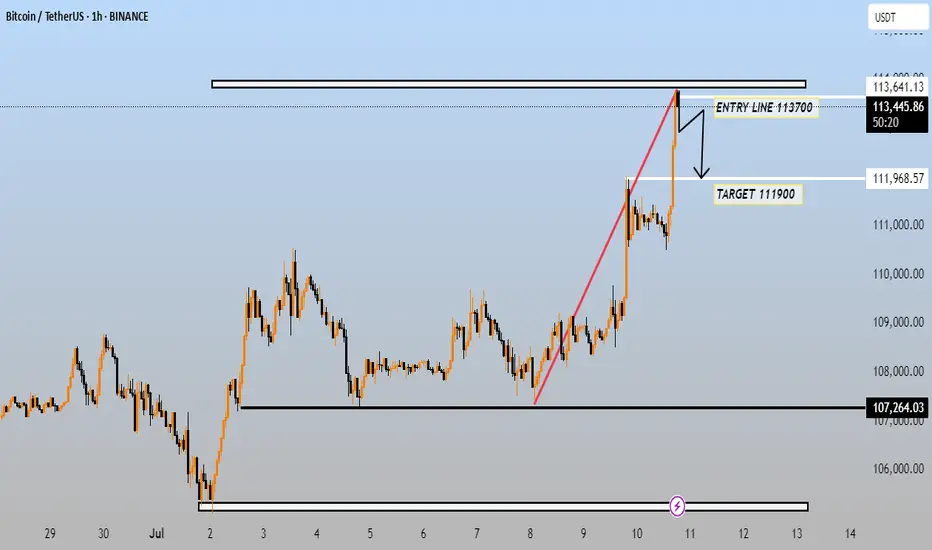
This chart is a Bitcoin (BTC) to Tether (USDT) trading setup on the 1-hour timeframe, published on July 10, 2025. Here’s a breakdown of the technical setup and what it suggests:
---
🔍 Key Levels & Strategy
Entry Line: 113,700 USDT
This is the suggested short (sell) entry point — indicating a potential price reversal or resistance zone near the recent high.
Target: 111,900 USDT
This is the take-profit target — implying a retracement expectation of around 1.6%.
Resistance Zone: Around 113,641.13 USDT
This is the recent local high where the price might face selling pressure.
Support Zone: 107,264.03 USDT
A much lower support area from earlier in July, likely the next major demand zone if the price drops significantly.
---
📉 Trade Idea Summary
Bias: Bearish (short position expected)
Rationale: After a strong upward move (marked by the red trend line), price hit resistance and is expected to correct downward.
Risk Management: The entry is near the high; a tight stop loss above 113,700 could be used to limit downside risk if the trade goes against the position.
---
⚠ Things to Watch
A confirmed rejection from the 113,700 level is important before shorting.
A breakout above 113,700 invalidates the short idea.
Look for bearish candlestick patterns (e.g., bearish engulfing or shooting star) for confirmation.
Would you like help setting up a stop loss or calculating the risk/reward ratio for this trade?
---
🔍 Key Levels & Strategy
Entry Line: 113,700 USDT
This is the suggested short (sell) entry point — indicating a potential price reversal or resistance zone near the recent high.
Target: 111,900 USDT
This is the take-profit target — implying a retracement expectation of around 1.6%.
Resistance Zone: Around 113,641.13 USDT
This is the recent local high where the price might face selling pressure.
Support Zone: 107,264.03 USDT
A much lower support area from earlier in July, likely the next major demand zone if the price drops significantly.
---
📉 Trade Idea Summary
Bias: Bearish (short position expected)
Rationale: After a strong upward move (marked by the red trend line), price hit resistance and is expected to correct downward.
Risk Management: The entry is near the high; a tight stop loss above 113,700 could be used to limit downside risk if the trade goes against the position.
---
⚠ Things to Watch
A confirmed rejection from the 113,700 level is important before shorting.
A breakout above 113,700 invalidates the short idea.
Look for bearish candlestick patterns (e.g., bearish engulfing or shooting star) for confirmation.
Would you like help setting up a stop loss or calculating the risk/reward ratio for this trade?
Join telegram free...
t.me/+16bIVCNBo0MzYzk0
Forex Gold & Crypto Signals with
detailed analysis & get consistent |
result ...
Gold Signals with peoper TP & SL for
high profit ...
t.me/+16bIVCNBo0MzYzk0
t.me/+16bIVCNBo0MzYzk0
Forex Gold & Crypto Signals with
detailed analysis & get consistent |
result ...
Gold Signals with peoper TP & SL for
high profit ...
t.me/+16bIVCNBo0MzYzk0
Disclaimer
The information and publications are not meant to be, and do not constitute, financial, investment, trading, or other types of advice or recommendations supplied or endorsed by TradingView. Read more in the Terms of Use.