Over the past 3 years, I’ve noticed that Bitcoin has been moving in a consistently bullish pattern, as shown on the chart.
After breaking out of the red ellipse shape, Bitcoin tends to rally strongly—and that’s usually the signal for altcoins to follow. We’ve now broken out of this ellipse, and it looks like the real bullish move is just beginning.
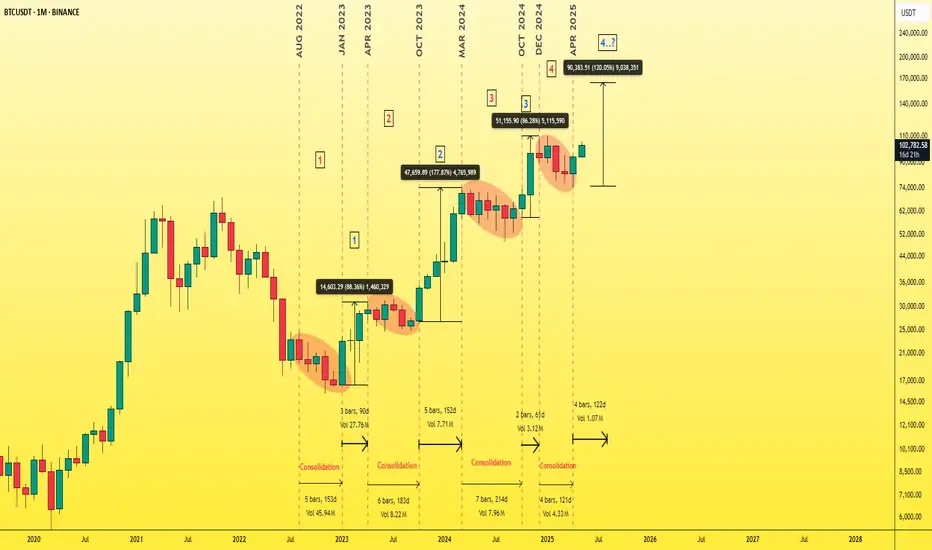
In this chart, I’ve tried to illustrate both the potential upside ahead of us and the estimated timeframe in which this move could unfold.
I’ve divided the chart into segments from August 2022 to April 2025.
🔸The red numbers 1, 2, 3, 4 indicate periods of consolidation.
🔸The blue numbers 1, 2, 3, 4 represent strong Bitcoin and altcoin rallies that follow the breakouts.
While the exact percentage gains and time durations may vary, if we take the average, we can estimate the upcoming move to be around 120%, taking Bitcoin to around $165K.
Similarly, the average time duration for each bullish move has been approximately 120 days.
[b]Welcome to the bull market.
Best Regards Ceciliones🎯
After breaking out of the red ellipse shape, Bitcoin tends to rally strongly—and that’s usually the signal for altcoins to follow. We’ve now broken out of this ellipse, and it looks like the real bullish move is just beginning.
In this chart, I’ve tried to illustrate both the potential upside ahead of us and the estimated timeframe in which this move could unfold.
I’ve divided the chart into segments from August 2022 to April 2025.
🔸The red numbers 1, 2, 3, 4 indicate periods of consolidation.
🔸The blue numbers 1, 2, 3, 4 represent strong Bitcoin and altcoin rallies that follow the breakouts.
While the exact percentage gains and time durations may vary, if we take the average, we can estimate the upcoming move to be around 120%, taking Bitcoin to around $165K.
Similarly, the average time duration for each bullish move has been approximately 120 days.
[b]Welcome to the bull market.
Best Regards Ceciliones🎯
🔻 free crypto signals🔻
t.me/itradeoncrypto
🎯 paid signals!🎯
t.me/Cecilion1
t.me/itradeoncrypto
🎯 paid signals!🎯
t.me/Cecilion1
Disclaimer
The information and publications are not meant to be, and do not constitute, financial, investment, trading, or other types of advice or recommendations supplied or endorsed by TradingView. Read more in the Terms of Use.