Bitcoin has been at a slow crawl for a while now even though there is strong selling pressure. The bulls have given it all they have got to stay afloat. We are quite clearly compressing and squeezing for the next move. What will it be; Up or Down?
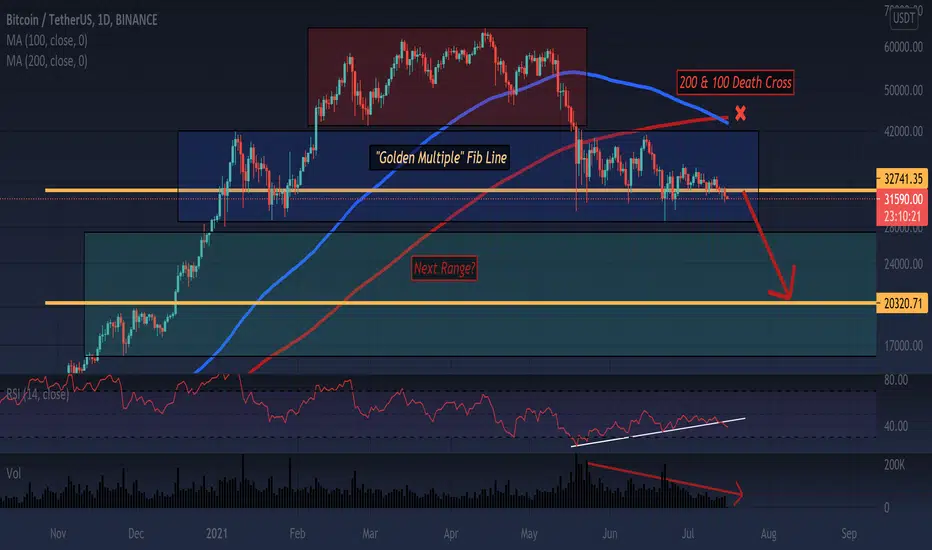
Here shown in the chart we see BTC is slowly being compressed down. This is due to very low volume and the bulls trying to hold support. There are a few lower time frame patterns that give the appearance of possible bullish scenarios and I see many traders holding hope. But let me explain why I'm leaning on the Bearish side at the time being given where we are at in the big picture.
Now I have to give credit where credit is due; I was previously not aware of this Fib Series charted out by EuroMotif and his post made a very clear big picture of the situation. Please go to his post (Either by clicking the chart here, or clicking his name) and check it out for yourself. Don't forget to show appreciation!

Here we see the "Genesis Fib" which is a wave series of Bitcoin since its inception. Yesterday BTC was at a critical level which is referred to as the "Golden Multiple" where it sits at exactly (32,741.35). All of yesterday the Bulls fought to stay above this level but ultimately fell short. This very well might have opened the door for more downside. The next "Golden Multiple" is at (20320.71)
On the contrary to this, if we see price action break above this golden line strongly, we may very well be seeing a Bullish Scenario taking place. It likely would drop to the bottom of the current range and we would see a Bullish Engulfing followed up with a spike in volume. This is the best scenario for the Bulls.
Here is a previous post of mine yesterday you can see BTC is still fighting Bearish Pattern after Bearish Pattern. The pressure on BTC is immense.

The Total Market Cap is another key indicator I'm watching to see where the health in the market stands because it is right at a crossroads where it must make a decision. It is right on long-term support created during this Bull Run and if that doesn't hold there will likely be more downside in a big way. The worst part is there are a number of Bearish Patterns present there as well. Check the chart yourself!

Furthermore, one of the last stands for hope was the Bullish Divergence on the Daily RSI. The last two days have seemingly invalidated this divergence and it looks like there has been a breakdown of this level.

Simply put, this is the calm before the storm. Once the storm arrives, you better make sure you're prepared to be on the right side of it!
The Mid Term Target could be anywhere from 25k-20k. At this moment I will not speculate lower until more signs are present. Things can change on a dime.
I am also paying attention to a likely relief bounce Bitcoin should endure at one point in time and I will be giving the signal when it shows itself. If you found this analysis helpful in any way, please let me know! Any questions are welcomed. Thank you all for making it this far in the post and I wish you the best! Happy Trading!
Here shown in the chart we see BTC is slowly being compressed down. This is due to very low volume and the bulls trying to hold support. There are a few lower time frame patterns that give the appearance of possible bullish scenarios and I see many traders holding hope. But let me explain why I'm leaning on the Bearish side at the time being given where we are at in the big picture.
Now I have to give credit where credit is due; I was previously not aware of this Fib Series charted out by EuroMotif and his post made a very clear big picture of the situation. Please go to his post (Either by clicking the chart here, or clicking his name) and check it out for yourself. Don't forget to show appreciation!
Here we see the "Genesis Fib" which is a wave series of Bitcoin since its inception. Yesterday BTC was at a critical level which is referred to as the "Golden Multiple" where it sits at exactly (32,741.35). All of yesterday the Bulls fought to stay above this level but ultimately fell short. This very well might have opened the door for more downside. The next "Golden Multiple" is at (20320.71)
On the contrary to this, if we see price action break above this golden line strongly, we may very well be seeing a Bullish Scenario taking place. It likely would drop to the bottom of the current range and we would see a Bullish Engulfing followed up with a spike in volume. This is the best scenario for the Bulls.
Here is a previous post of mine yesterday you can see BTC is still fighting Bearish Pattern after Bearish Pattern. The pressure on BTC is immense.
The Total Market Cap is another key indicator I'm watching to see where the health in the market stands because it is right at a crossroads where it must make a decision. It is right on long-term support created during this Bull Run and if that doesn't hold there will likely be more downside in a big way. The worst part is there are a number of Bearish Patterns present there as well. Check the chart yourself!
Furthermore, one of the last stands for hope was the Bullish Divergence on the Daily RSI. The last two days have seemingly invalidated this divergence and it looks like there has been a breakdown of this level.
Simply put, this is the calm before the storm. Once the storm arrives, you better make sure you're prepared to be on the right side of it!
The Mid Term Target could be anywhere from 25k-20k. At this moment I will not speculate lower until more signs are present. Things can change on a dime.
I am also paying attention to a likely relief bounce Bitcoin should endure at one point in time and I will be giving the signal when it shows itself. If you found this analysis helpful in any way, please let me know! Any questions are welcomed. Thank you all for making it this far in the post and I wish you the best! Happy Trading!
Note
Note
Here is an updated outlook on the historical Bull Run Cycles of BTC. I encourage you to take a look at this post and hopefully will give some insight into the situation. Thank you all again!
Disclaimer
The information and publications are not meant to be, and do not constitute, financial, investment, trading, or other types of advice or recommendations supplied or endorsed by TradingView. Read more in the Terms of Use.
Disclaimer
The information and publications are not meant to be, and do not constitute, financial, investment, trading, or other types of advice or recommendations supplied or endorsed by TradingView. Read more in the Terms of Use.