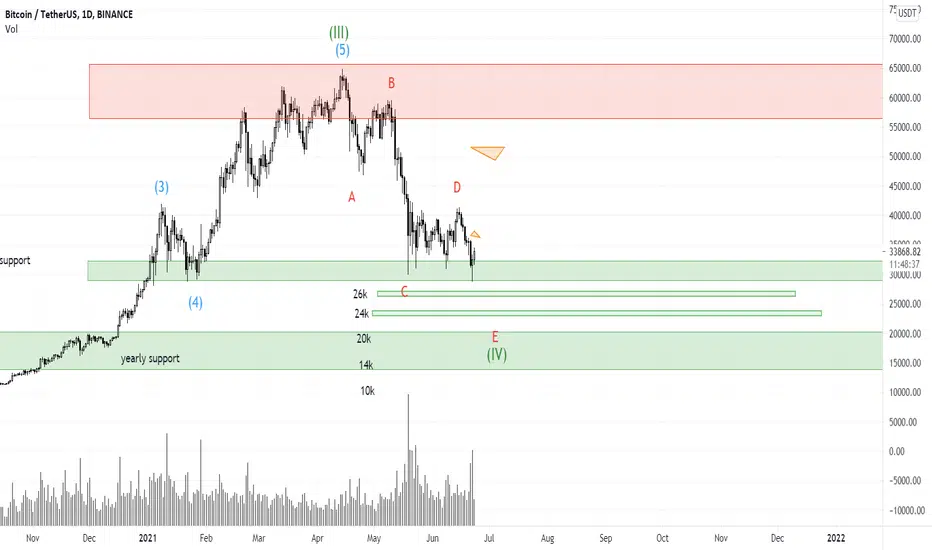
I think there are two scenarios:
Triangular correction: as you can see in the chart , price can reach one of the triangles I drew , and then can drop into 24k ,20k (more possible) , 14k and 10k levels.
flat or zigzag correction: as i said in my previous idea ,The price can reach one of the triangles I drew , and then can drop into 26k, 24k, 20k levels.
PS: I believe BTC can reach 65k this year.
Disclaimer
The information and publications are not meant to be, and do not constitute, financial, investment, trading, or other types of advice or recommendations supplied or endorsed by TradingView. Read more in the Terms of Use.
Disclaimer
The information and publications are not meant to be, and do not constitute, financial, investment, trading, or other types of advice or recommendations supplied or endorsed by TradingView. Read more in the Terms of Use.