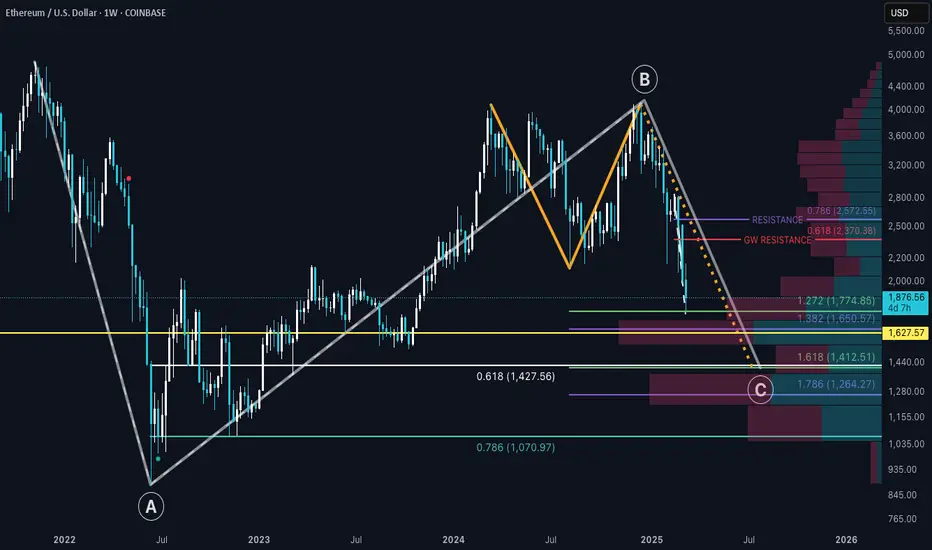
ETH tagged the 1:1.272 pocket recently and bounced right off. This pocket is a major support area; given the HVN (High Volume Node) that rests in that zone.
This asset may start to show signs of strength compared to Bitcoin as we come closer to alt coin season (yes, I highly favor an alt coin season). But the question is when?
That transition could start during this correctional phase or shortly after. So trying to pinpoint the correctional bottom for ETH may be challenging.
As USDT.T has the potential to form higher local highs, I would imagine that ETH would print a lower low. There is a POC (Point of Control: Yellow Horizontal Line) that the lower low could hit @ $1627.57. If that is the case, this would suggest that ETH is indeed starting to show signs of strength compared to BTC.
If support breaks in that area, the next stop is the 1:1.618 pocket @ $1412.51. If this happens, I believe that anything lower than that support window (ending at the 1.786; $1264.27) would not be up for grabs. I'm going to label this scenario as "worst case"; The 1:1.618 GW correction.
When considering higher time frame 3 wave corrections (The gray ABC wave structure) a noticeably potential point of support is at the 1:0.618 of that larger ABC wave structure @ $1427.56.
So with these combined support structures in mind; I'm going to favor this area as the potential correctional bottom for ETH. I could be wrong, and ETH finds support at the POC horizontal ray, but only time can tell.
Good Luck Traders!
Disclaimer
The information and publications are not meant to be, and do not constitute, financial, investment, trading, or other types of advice or recommendations supplied or endorsed by TradingView. Read more in the Terms of Use.
Disclaimer
The information and publications are not meant to be, and do not constitute, financial, investment, trading, or other types of advice or recommendations supplied or endorsed by TradingView. Read more in the Terms of Use.
