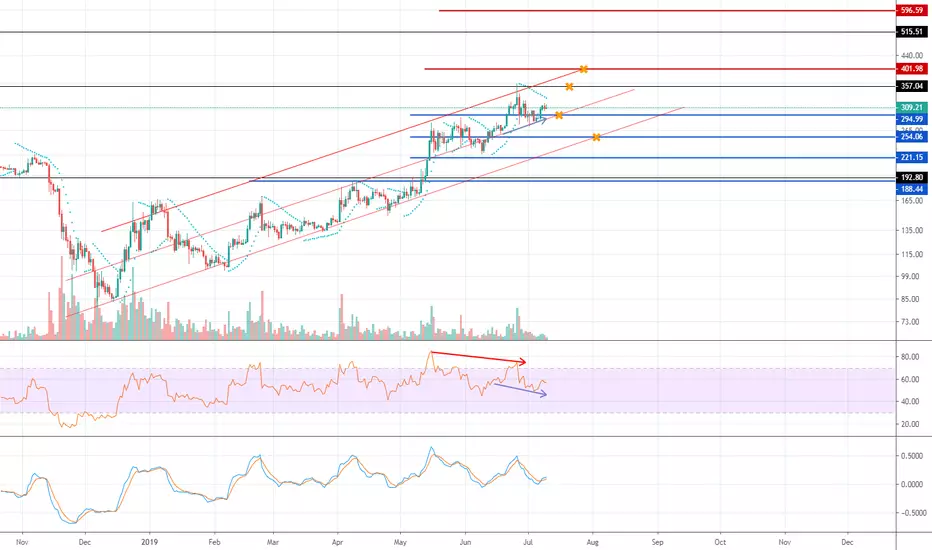
Here we have ETH/USD trading within an upward channel. Currently we are above the middle support zone of the channel but it looks as though we are going to retest that support around the 295 zone which is a Fib retracement as well. If this does not hold I suspect we will test the bottom of the channel and the next lower Fib retracement at the 255.86 area. If we do get a bounce of the middle support of the channel we should retest the short term high level and previous resistance turned support at the 360 level. If we break above this I believe we will be headed to 403, a Fib extension from the last swing low (Jan to Dec 2018) and the top of the channel. I would certainly like to see more volume come in to this move.
Hidden bullish divergence = Continuation of trend
Bearish divergence = Possible reversal
Parabolic SAR not yet printing buy signal
SMI Ergotic cross = Bullish
-If you're a little more bold I would wait until we get a bounce off the middle trend line with confirmation from Parabolic SAR and SMI Ergotic Indicator before going long.
-If you're a little more cautious I would wait to see if we break below middle trend line and have a confirmed bounce off the bottom of the channel.
Let me know what you think, what are your targets?
When does divergence become invalid?
Thanks
Disclaimer
The information and publications are not meant to be, and do not constitute, financial, investment, trading, or other types of advice or recommendations supplied or endorsed by TradingView. Read more in the Terms of Use.
Disclaimer
The information and publications are not meant to be, and do not constitute, financial, investment, trading, or other types of advice or recommendations supplied or endorsed by TradingView. Read more in the Terms of Use.