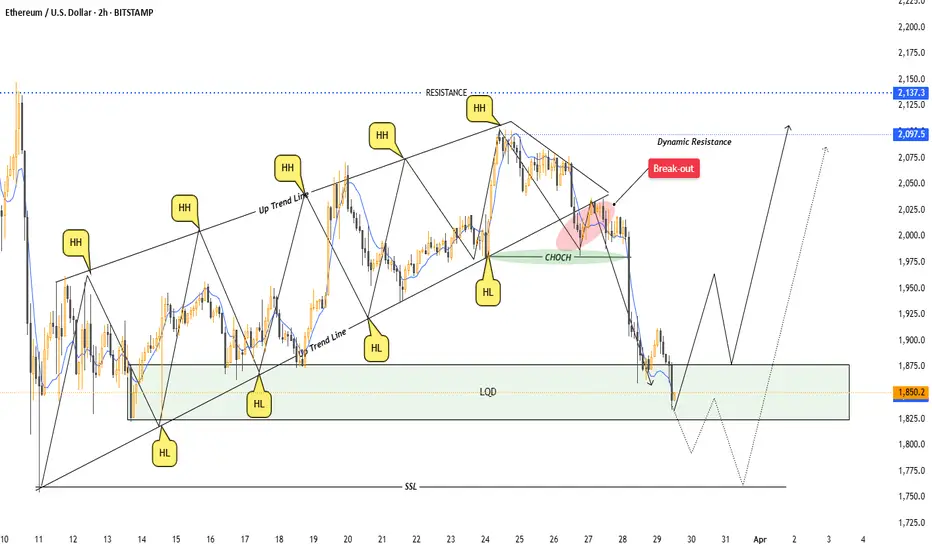
### * ETHUSD 2-hour time frame chart analysis".
#### *Tools Used:*
1. *Trend Lines:*
- An *uptrend channel* is drawn using two parallel trend lines, connecting *higher highs (HH) and higher lows (HL)*.
- A *breakout from the trendline* is marked, indicating a possible reversal.
2. *Labels & Annotations:*
- *HH (Higher Highs) and HL (Higher Lows)* are labeled to define the previous bullish structure.
- *CHOCH (Change of Character)* is highlighted, marking a shift in market direction.
- *Breakout Zone* is marked in red, indicating where price broke the trendline.
- *Dynamic Resistance* is labeled, suggesting a key level where price may face rejection.
3. *Liquidity Zone (LQD):*
- A *rectangular box (gray shaded area)* highlights a liquidity zone around 1,825–1,875 USD.
- This zone represents potential support where buyers may step in.
4. *Price Projection Paths:*
- Two *potential price movement paths* are drawn using curved lines.
- One suggests a bounce from the liquidity zone into an uptrend.
- The other suggests further consolidation before a breakout.
---
#### *Patterns Identified:*
1. *Uptrend Channel (Higher Highs and Higher Lows)*
- Before the breakout, the price followed a clear *higher highs (HH) and higher lows (HL) structure*.
2. *Change of Character (CHOCH)*
- Marked in blue, indicating a possible *trend reversal from bullish to bearish*.
3. *Breakout & Retest Pattern*
- The price *broke below the trendline*, confirming bearish momentum.
- A *potential retest* of the previous support (now resistance) may occur.
4. *Support & Resistance Levels:*
- *Resistance:* Marked near *2,125 - 2,150 USD*, a key level where price might struggle.
- *Support (Liquidity Zone):* Around *1,825 - 1,875 USD*, where buyers might step in.
### *Conclusion:*
This chart uses *trend lines, market structure analysis, breakout patterns, liquidity zones, and price projections* to predict potential future price movements. It suggests that the market is at a key decision point, where it could either bounce from support or continue downward before a reversal
Join Telegram Channel Free t.me/+lvC6DGTZAqk3NTI8 "Explore daily insights: 4/5 signals meticulously analyzed, ensuring an impressive 99% accuracy in forex & crypto trades t.me/+XHUwVU1EKek0Nzlk
Disclaimer
The information and publications are not meant to be, and do not constitute, financial, investment, trading, or other types of advice or recommendations supplied or endorsed by TradingView. Read more in the Terms of Use.