Key Observations:
Session Analysis & Structure:
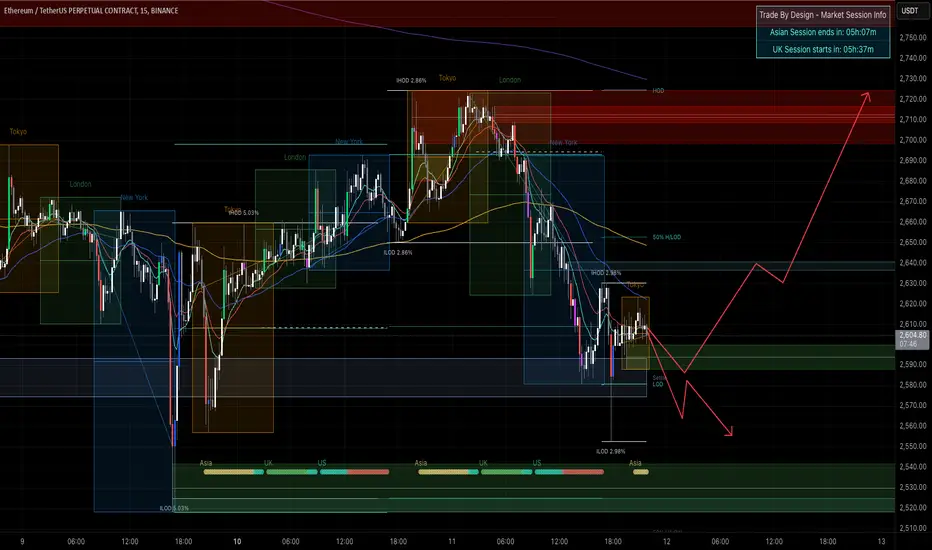
HOD (High of Day) and LOD (Low of Day) are clearly marked.
Tokyo session is consolidating near the LOD (2.97%), which could indicate the formation of a potential W pattern for a reversal.
The New York session completed a significant bearish move after peaking at iHOD (5.03%), typical of a US session reversal.
EMA & Trend Dynamics:
The 10/20/50 EMAs are stacked bearishly, with price hovering below the 50 EMA.
The 200 EMA is acting as a significant overhead resistance, and price needs to break and hold above it for a bullish shift.
Indicators:
RSI Divergence:
There are multiple bullish divergences on RSI at the LOD, which suggests weakening bearish momentum.
Stochastic & MACD:
Both indicators are starting to curl up from oversold levels, signaling a potential reversal.
Volumes & Candlestick Patterns:
PVSRA volume spikes indicate possible Market Maker activity at the LOD, which aligns with a trapped traders scenario.
Look for Stopping Volume Candles (SVC) at this level to confirm a reversal.
Strategy Suggestions:
Aggressive Long Entry:
Enter near the LOD if you see a W formation confirmation with a stop just below the LOD (2.97%).
Target: 200 EMA, followed by the HOD.
Conservative Long Entry:
Wait for a Break, Close, Retest (BCR) of the 50 EMA for confirmation of a bullish reversal.
Target: Midway between the 50 EMA and 200 EMA.
Bearish Continuation:
If price breaks below the LOD with strong volume and no SVCs, look for continuation towards the next support zone around 2,550.
Session Analysis & Structure:
HOD (High of Day) and LOD (Low of Day) are clearly marked.
Tokyo session is consolidating near the LOD (2.97%), which could indicate the formation of a potential W pattern for a reversal.
The New York session completed a significant bearish move after peaking at iHOD (5.03%), typical of a US session reversal.
EMA & Trend Dynamics:
The 10/20/50 EMAs are stacked bearishly, with price hovering below the 50 EMA.
The 200 EMA is acting as a significant overhead resistance, and price needs to break and hold above it for a bullish shift.
Indicators:
RSI Divergence:
There are multiple bullish divergences on RSI at the LOD, which suggests weakening bearish momentum.
Stochastic & MACD:
Both indicators are starting to curl up from oversold levels, signaling a potential reversal.
Volumes & Candlestick Patterns:
PVSRA volume spikes indicate possible Market Maker activity at the LOD, which aligns with a trapped traders scenario.
Look for Stopping Volume Candles (SVC) at this level to confirm a reversal.
Strategy Suggestions:
Aggressive Long Entry:
Enter near the LOD if you see a W formation confirmation with a stop just below the LOD (2.97%).
Target: 200 EMA, followed by the HOD.
Conservative Long Entry:
Wait for a Break, Close, Retest (BCR) of the 50 EMA for confirmation of a bullish reversal.
Target: Midway between the 50 EMA and 200 EMA.
Bearish Continuation:
If price breaks below the LOD with strong volume and no SVCs, look for continuation towards the next support zone around 2,550.
Trade active
2580 as per the chart not 2280 as title says Disclaimer
The information and publications are not meant to be, and do not constitute, financial, investment, trading, or other types of advice or recommendations supplied or endorsed by TradingView. Read more in the Terms of Use.
Disclaimer
The information and publications are not meant to be, and do not constitute, financial, investment, trading, or other types of advice or recommendations supplied or endorsed by TradingView. Read more in the Terms of Use.