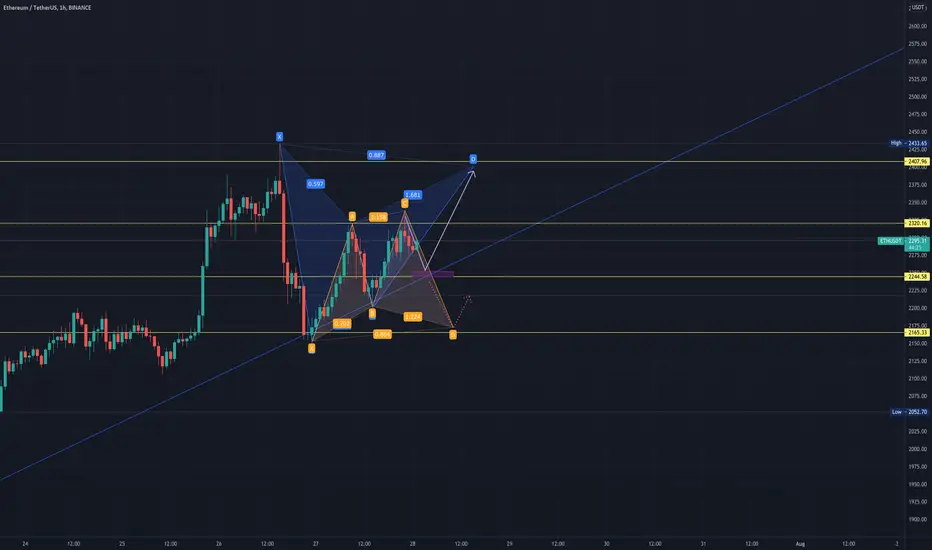
From 1H chart, there could be two harmonic patterns overlapping, SHARK and BAT:
1. ETHUSD is trying to form a SHARK pattern, downward to D (yellow) point at 2170 region, then get reversal; D could be a good point for buy;
2. It could likely hit 2240 region and be supported by the trend line, then upward to D (blue) point at 2410 region of a BAT pattern.
Let's see what is going on.
Disclaimer
The information and publications are not meant to be, and do not constitute, financial, investment, trading, or other types of advice or recommendations supplied or endorsed by TradingView. Read more in the Terms of Use.
Disclaimer
The information and publications are not meant to be, and do not constitute, financial, investment, trading, or other types of advice or recommendations supplied or endorsed by TradingView. Read more in the Terms of Use.