1. Market Structure & Trend
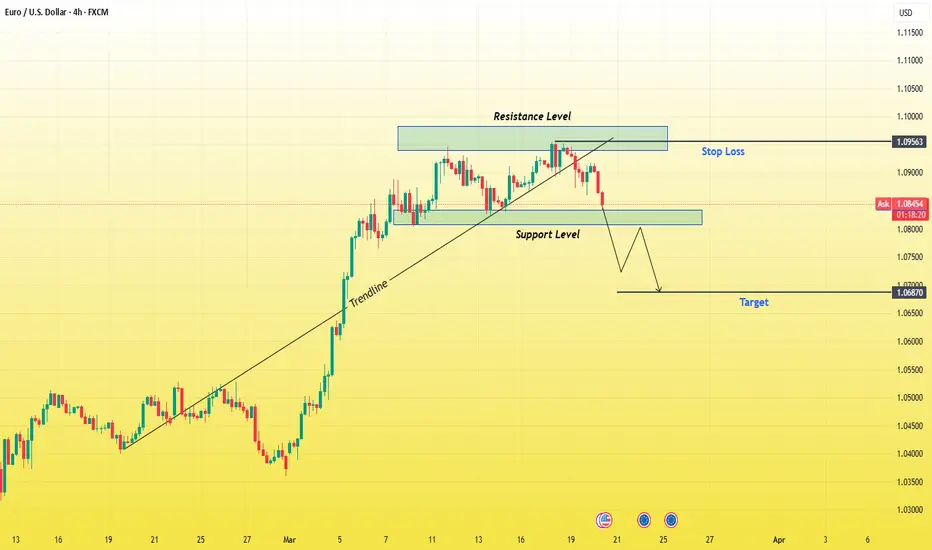
The EUR/USD chart shows a previous uptrend, confirmed by the ascending trendline, where the price made higher highs and higher lows. However, the trendline has now been broken, signaling a potential shift in market direction. The price is currently retracing from a key resistance zone, and a possible bearish continuation is expected.
2. Key Levels & Zones
✅ Resistance Zone (1.09563 - 1.1000):
This blue-shaded area represents a strong resistance level, where sellers have stepped in multiple times.
Price previously attempted to break this level but failed, forming a rejection.
This suggests buyers are losing strength, and sellers are likely to dominate.
✅ Support Level (1.0800 - 1.0780):
A critical support zone, which acted as a demand area in the past.
If price breaks below this level with strong bearish momentum, it confirms a trend reversal.
✅ Target Level (1.06870):
The next major downside target aligns with previous market structure and liquidity zones.
This area marks a key demand zone, where buyers might step in again.
3. Trade Setup & Execution Plan
🔹 Entry Strategy
A sell entry is ideal on a confirmed break and retest of the support zone at 1.0800.
If price retests this level and forms bearish rejection candles (such as pin bars or engulfing patterns), it strengthens the bearish bias.
🔹 Stop Loss & Risk Management
A stop loss should be placed above the resistance zone at 1.09563, ensuring a safe exit if the market reverses bullish.
Risk-to-Reward Ratio (RRR):
Entry: Below 1.0800 (after confirmation).
Stop Loss: Above 1.09563 (resistance zone).
Target: 1.06870 (support zone).
RRR: Around 1:3, meaning potential profit is three times the risk.
4. Confirmation Indicators & Confluences
✅ Bearish Trendline Break:
The ascending trendline has been broken, confirming a possible shift in trend.
✅ Support Flip:
If the price breaks support and retests it as resistance, it confirms bearish continuation.
✅ Price Action Candlestick Patterns:
Look for bearish engulfing candles, pin bars, or rejection wicks at key levels.
✅ Volume Analysis:
Increased selling pressure after support break indicates strong bearish momentum.
5. Final Thoughts & Bias
📉 Bias: Bearish (Unless resistance is reclaimed).
💡 Key Watch: Break and retest of 1.0800 support for confirmation.
⚠️ Risk Management: Always use a stop loss to manage risk effectively.
Conclusion
This setup presents a high-probability short trade with a clear entry, stop loss, and target. Traders should wait for confirmation signals before executing the trade. If price breaks above resistance, the bearish outlook is invalidated.
🔔 Stay cautious and trade with discipline! 🚀
Related publications
Disclaimer
The information and publications are not meant to be, and do not constitute, financial, investment, trading, or other types of advice or recommendations supplied or endorsed by TradingView. Read more in the Terms of Use.
Related publications
Disclaimer
The information and publications are not meant to be, and do not constitute, financial, investment, trading, or other types of advice or recommendations supplied or endorsed by TradingView. Read more in the Terms of Use.