In this chart we see a strong decline and a shift in momentum with the trendline breakout.
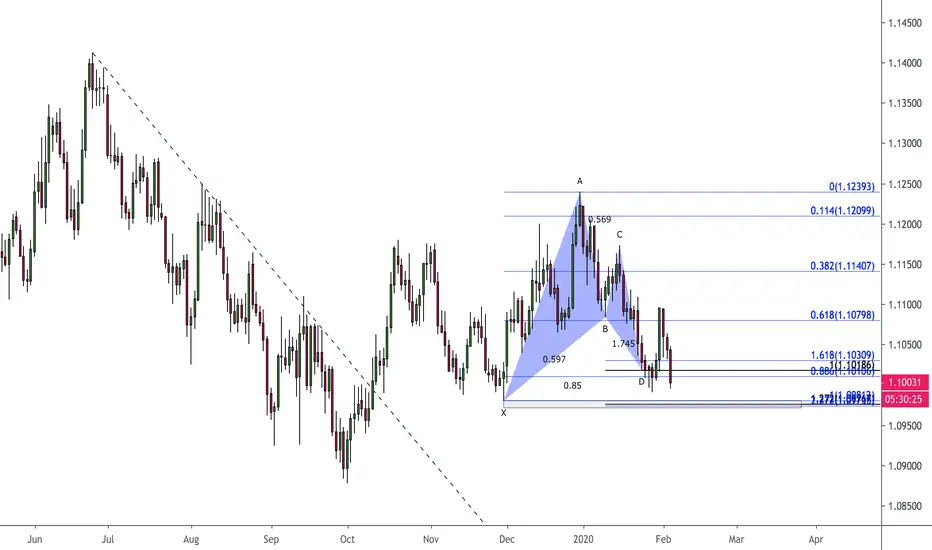
The chart is painting higher highs and higher lows suggesting this market is in an uptrend.
We then see a Gartley 886 pattern
1.618 should be top range of PRZ in Gartley patterns but in this case we see it is not.
Now another PCZ anticipates strong support around 1.097-1.098. Support is usually below prices with resistance above, therefor it would be smart to speculate in long positions with tight stops below prior lows.
Thank you for reading and make sure to check related ideas for more info
Comment your thoughts below if any.
Leave the chart a like as a sign of appreciation
God bless
Related publications
Disclaimer
The information and publications are not meant to be, and do not constitute, financial, investment, trading, or other types of advice or recommendations supplied or endorsed by TradingView. Read more in the Terms of Use.
Related publications
Disclaimer
The information and publications are not meant to be, and do not constitute, financial, investment, trading, or other types of advice or recommendations supplied or endorsed by TradingView. Read more in the Terms of Use.