FXI Technical Analysis: Testing Key Support Before Potential Upward Move on Policy Developments
Description:
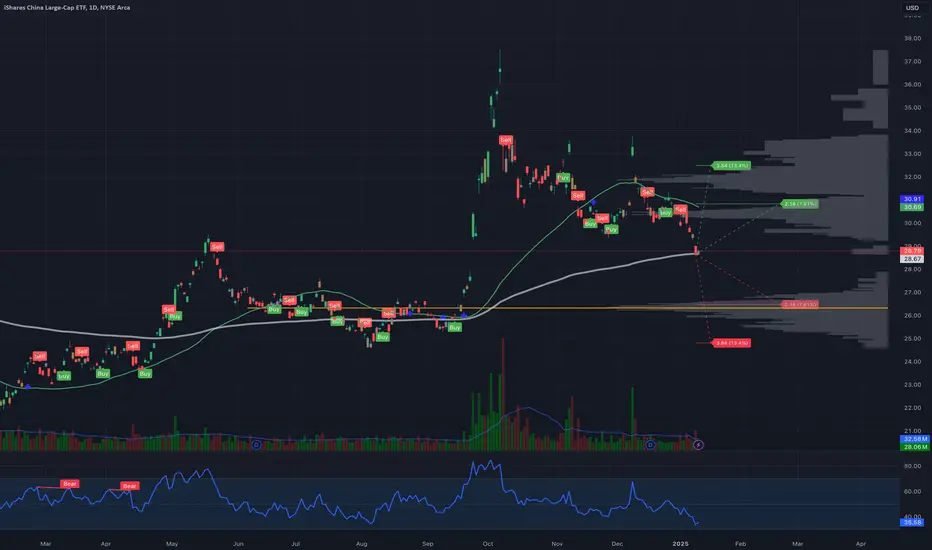
In this analysis, we examine FXI (FTSE China 50 Index ETF) and its recent volatility trends between January 17 and February 21, 2025. FXI has seen a significant drop in implied volatility from 117.10% to 37.82%, accompanied by a drastic reduction in open interest from 123,059 to 5,247. This indicates a potential decrease in market uncertainty regarding the Chinese market.
Key Points:
Implied Volatility: Decreased from 117.10% to 37.82%
Open Interest: Decreased from 123,059 to 5,247
Near-term Volatility: 3.10 (>1 abnormal)
Analysis: FXI is likely to test the lower support level around January 17, which also aligns with a critical resistance area. Following this, based on upcoming policy decisions related to Trump’s inauguration and U.S.-China relations, FXI may either move upwards or consolidate sideways. My assessment leans towards a greater potential for an upward movement, driven by positive policy developments.
Trading Strategy:
Support Test: Monitor FXI as it approaches the key support level for potential entry points.
Upward Bias: Look for bullish signals post-support test to capitalize on the anticipated upward move.
Risk Management: Implement stop-loss orders to protect against unexpected downward movements.
Join the Discussion: What are your thoughts on FXI’s potential move? Do you agree with the upward bias based on policy developments? Share your insights in the comments below!
Description:
In this analysis, we examine FXI (FTSE China 50 Index ETF) and its recent volatility trends between January 17 and February 21, 2025. FXI has seen a significant drop in implied volatility from 117.10% to 37.82%, accompanied by a drastic reduction in open interest from 123,059 to 5,247. This indicates a potential decrease in market uncertainty regarding the Chinese market.
Key Points:
Implied Volatility: Decreased from 117.10% to 37.82%
Open Interest: Decreased from 123,059 to 5,247
Near-term Volatility: 3.10 (>1 abnormal)
Analysis: FXI is likely to test the lower support level around January 17, which also aligns with a critical resistance area. Following this, based on upcoming policy decisions related to Trump’s inauguration and U.S.-China relations, FXI may either move upwards or consolidate sideways. My assessment leans towards a greater potential for an upward movement, driven by positive policy developments.
Trading Strategy:
Support Test: Monitor FXI as it approaches the key support level for potential entry points.
Upward Bias: Look for bullish signals post-support test to capitalize on the anticipated upward move.
Risk Management: Implement stop-loss orders to protect against unexpected downward movements.
Join the Discussion: What are your thoughts on FXI’s potential move? Do you agree with the upward bias based on policy developments? Share your insights in the comments below!
Disclaimer
The information and publications are not meant to be, and do not constitute, financial, investment, trading, or other types of advice or recommendations supplied or endorsed by TradingView. Read more in the Terms of Use.
Disclaimer
The information and publications are not meant to be, and do not constitute, financial, investment, trading, or other types of advice or recommendations supplied or endorsed by TradingView. Read more in the Terms of Use.