Current Indicators:
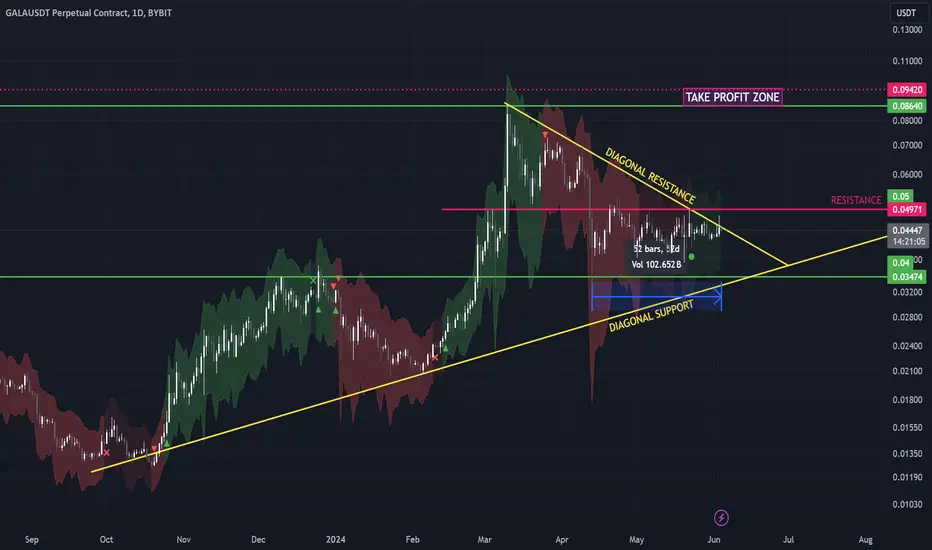
Weekly Support: We are currently above the weekly support level at $0.03474.
Yellow Diagonal Support Trendline: The price is holding above the yellow diagonal support trendline.
Accumulation Zone: We've had 52 days of price accumulation, with the price bouncing within a range.
Momentum Indicator: The "Squeeze Momentum TD - A Revisited Version of the TTM Squeeze" is currently dark green, indicating a mildly bullish sentiment.
Overall Trend: We are in an overall uptrend.
What's Missing for Confirmation:
Break Above Diagonal Yellow Resistance Trendline: We need to see a break above this key resistance level.
Break Above Key Resistance at $0.04971: Clearing this resistance would further confirm a bullish trend.
Target Price (TP) Zone:
TP Zone: $0.09 area
Conclusion:
If we break above both the diagonal yellow resistance trendline and the key resistance at $0.04971, this presents a very good long opportunity. Keep an eye on these levels for confirmation.
Tik Tok: @tradingparadise.io
Disclaimer
The information and publications are not meant to be, and do not constitute, financial, investment, trading, or other types of advice or recommendations supplied or endorsed by TradingView. Read more in the Terms of Use.
Tik Tok: @tradingparadise.io
Disclaimer
The information and publications are not meant to be, and do not constitute, financial, investment, trading, or other types of advice or recommendations supplied or endorsed by TradingView. Read more in the Terms of Use.