Hello everybody!
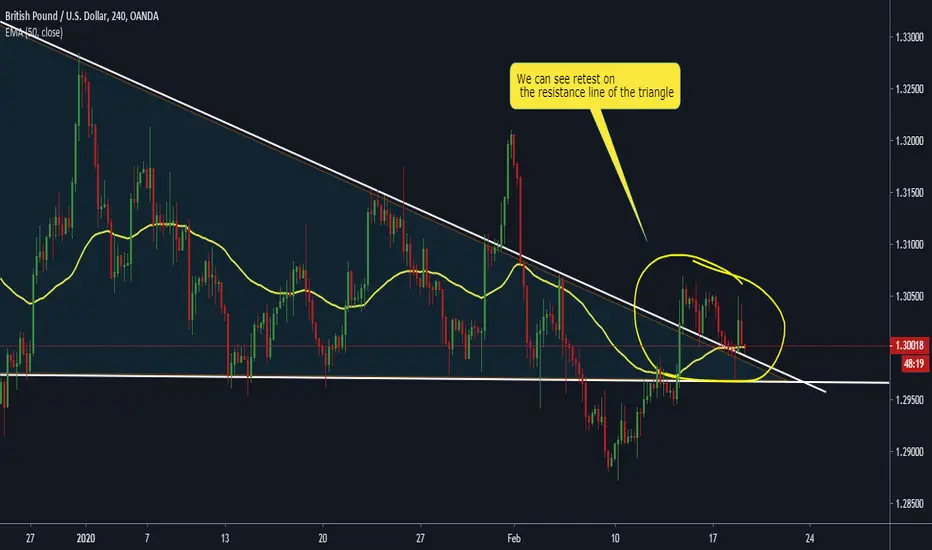
-On a 4-hour time frame, we can see that price broke resistance line of a triangle pattern and then the price started moving in bullish direction and then the price started falling in a bearish direction and now we can see that the price tested resistance line and the price rejected but it is still moving in bearish direction.
-We can also see that 50 periods EMA is supporting the last 2 candles and resisting few candles in the past.
-On a daily base, GBP is stronger than USD and on a weekly chart, USD is stronger than GBP. If GBP remains stronger during the night we can expect bullish movement and if GBP loses its power and USD overpowers GBP we can expect bearish movement.
-WHAT DO YOU THINK ABOUT THIS SETUP?
Please let me know in the comment section!
THANKS FOR READING!
-If you have some different opinions please let me know and if you like this please hit that like button and give me support, I will appreciate every support.
-Remember this analysis is not 100% accurate. No single analysis is. To make a decision follow your own thoughts. The information given is not a Financial
advice.
Note
-In the past, we had few retests on the resistance line of the triangle pattern.-I consider this as a buying opportunity with solid risk-reward ration,...-But that is just my opinion.
-For buy opportunity GBP must remain stronger than USD and on lower time frames we need to find a good buy signal and more confirmations
Thanks for reeding!
Disclaimer
The information and publications are not meant to be, and do not constitute, financial, investment, trading, or other types of advice or recommendations supplied or endorsed by TradingView. Read more in the Terms of Use.
Disclaimer
The information and publications are not meant to be, and do not constitute, financial, investment, trading, or other types of advice or recommendations supplied or endorsed by TradingView. Read more in the Terms of Use.