As of June 6, 2025, Gillette India Ltd. (NSE: GILLETTE) is trading at approximately ₹10,232.00, marking a 27.45% increase over the past month.
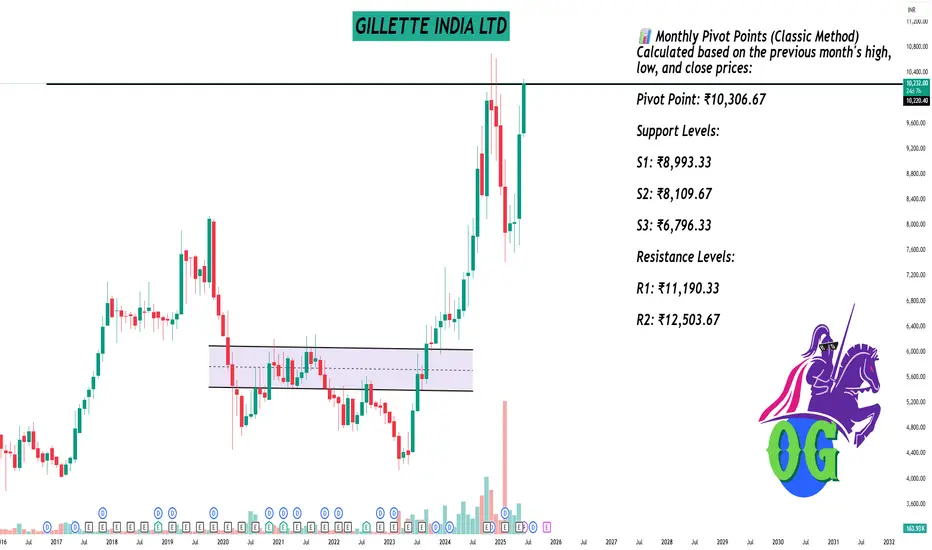
📊 Monthly Pivot Points (Classic Method)
Calculated based on the previous month's high, low, and close prices:
Pivot Point: ₹10,306.67
Support Levels:
S1: ₹8,993.33
S2: ₹8,109.67
S3: ₹6,796.33
Resistance Levels:
R1: ₹11,190.33
R2: ₹12,503.67
🔍 Fibonacci Pivot Points
Based on Fibonacci calculations:
Pivot Point: ₹10,306.67
Support Levels:
S1: ₹9,832.59
S2: ₹8,154.08
S3: ₹6,796.33
Resistance Levels:
R1: ₹10,351.08
R2: ₹11,190.33
📈 Technical Indicators Summary
Moving Averages: All major moving averages (MA5, MA10, MA20, MA50, MA100, MA200) are indicating a Strong Buy signal.
Relative Strength Index (RSI): 81.19 – Overbought
MACD: 194.05 – Buy
ADX: 96.24 – Overbought
Stochastic Oscillator: 82.92 – Overbought
📌 Trading Insights
Immediate Resistance: ₹11,190.33 (Classic R1)
Immediate Support: ₹8,993.33 (Classic S1)
Given the current price of ₹10,232.00, the stock is trading near its pivot point, suggesting potential for upward movement if it breaks above the immediate resistance. However, the overbought RSI and ADX indicators suggest caution, as the stock may be due for a short-term correction.
Hello Guys ..
WhatsApp link- wa.link/d997q0
Email - techncialexpress@gmail.com ...
Script Coder/Trader//Investor from India. Drop a comment or DM if you have any questions! Let’s grow together!
WhatsApp link- wa.link/d997q0
Email - techncialexpress@gmail.com ...
Script Coder/Trader//Investor from India. Drop a comment or DM if you have any questions! Let’s grow together!
Related publications
Disclaimer
The information and publications are not meant to be, and do not constitute, financial, investment, trading, or other types of advice or recommendations supplied or endorsed by TradingView. Read more in the Terms of Use.