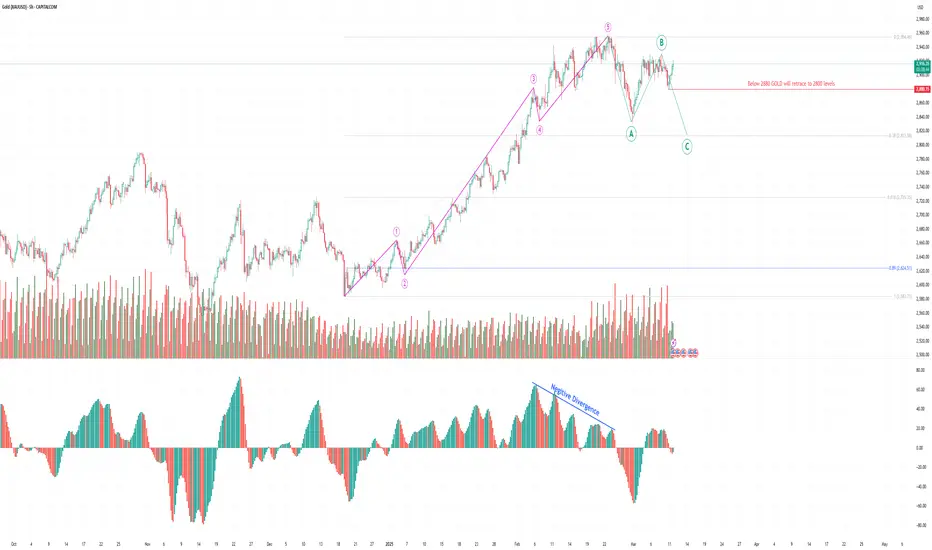
Impulse Wave (1-5)-, the chart shows a completed five-wave impulse structure (marked in pink).
Wave 1 starts an upward rally.
Wave 2 is a corrective pullback.
Wave 3 is the strongest upward leg.
Wave 4 consolidates before the final rally.
Wave 5 completes the impulse move.
Corrective Wave (ABC)
A three-wave correction (ABC) has started after the impulse wave.
Wave A initiated the first leg of the drop.
Wave B provided a short-term retracement.
Wave C is expected to extend downward, completing the correction.
Negative Divergence Confirmation
The Awesome oscillator shows negative divergence, indicating momentum loss before the correction.
This confirms that the strong upward trend had weakened.
Key Support & Resistance Levels
2800 Level: Crucial support zone—if broken, further downside is likely.
38.2% Fibonacci Retracement (~2800): Initial support level.
61.8% Fibonacci (~2725): A deeper correction could test this level.
Further downside target: 2600-2500, if selling accelerates.
Trading Plan & Considerations
Bullish Case: If Gold holds above 2800 and breaks recent highs, the uptrend may continue.
Bearish Case: If Gold breaks below 2800, expect further decline towards 2725-2600.
Volume Analysis: Increasing red volume suggests strong selling pressure.
Disclaimer
⚠️ This analysis is for informational and educational purposes only. It does not constitute financial advice, investment recommendations, or trade execution strategies. Trading involves significant risk, and you should conduct your own research or consult a financial advisor before making any decisions. Past performance does not guarantee future results. Trade at your own risk.
Disclaimer
The information and publications are not meant to be, and do not constitute, financial, investment, trading, or other types of advice or recommendations supplied or endorsed by TradingView. Read more in the Terms of Use.
Disclaimer
The information and publications are not meant to be, and do not constitute, financial, investment, trading, or other types of advice or recommendations supplied or endorsed by TradingView. Read more in the Terms of Use.