As of June 4, 2025, Garden Reach Shipbuilders & Engineers Ltd (NSE: GRSE) is trading at ₹3,150.50, marking a 6.22% increase for the day and reaching a new 52-week high .
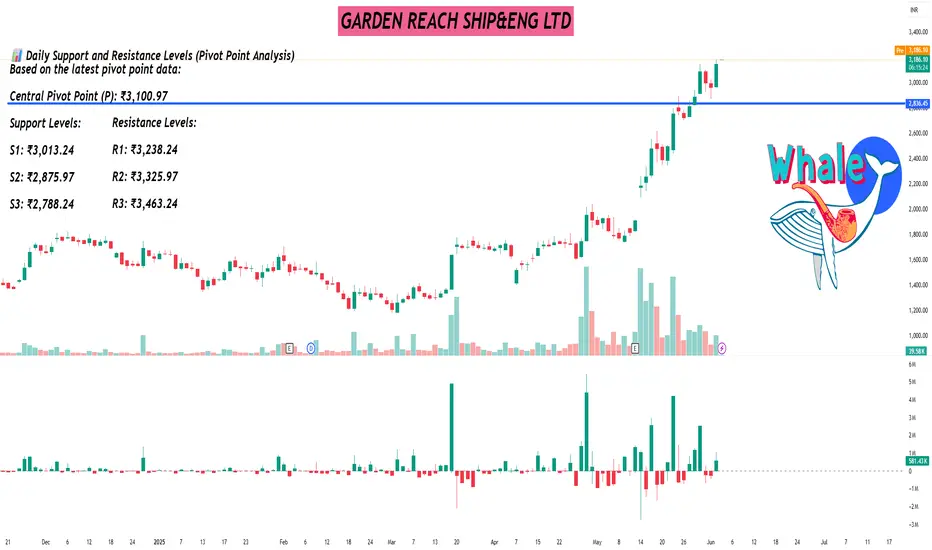
📊 Daily Support and Resistance Levels (Pivot Point Analysis)
Based on the latest pivot point data:
Central Pivot Point (P): ₹3,100.97
Support Levels:
S1: ₹3,013.24
S2: ₹2,875.97
S3: ₹2,788.24
Resistance Levels:
R1: ₹3,238.24
R2: ₹3,325.97
R3: ₹3,463.24
These levels are derived from standard pivot point calculations and are commonly used by traders to identify potential support and resistance zones .
📈 Technical Overview
Trend: The stock has demonstrated strong upward momentum, with a 15.15% increase over the past week and a 64.35% rise over the past month .
Volatility: GRSE exhibits high volatility, with a beta coefficient of 3.08, indicating that the stock is more volatile than the market average .
Relative Strength Index (RSI): The 14-day RSI stands at 75.78, suggesting that the stock is in overbought territory, which may precede a price correction .
🔍 Additional Insights
Recent technical indicators suggest that GRSE is experiencing strong bullish momentum. However, the elevated RSI indicates that the stock may be overbought, and investors should be cautious of potential short-term corrections.
Please note that stock prices are subject to market risks and can change rapidly. It's advisable to consult with a financial advisor before making investment decisions.
Hello Guys ..
WhatsApp link- wa.link/d997q0
Email - techncialexpress@gmail.com ...
Script Coder/Trader//Investor from India. Drop a comment or DM if you have any questions! Let’s grow together!
WhatsApp link- wa.link/d997q0
Email - techncialexpress@gmail.com ...
Script Coder/Trader//Investor from India. Drop a comment or DM if you have any questions! Let’s grow together!
Related publications
Disclaimer
The information and publications are not meant to be, and do not constitute, financial, investment, trading, or other types of advice or recommendations supplied or endorsed by TradingView. Read more in the Terms of Use.