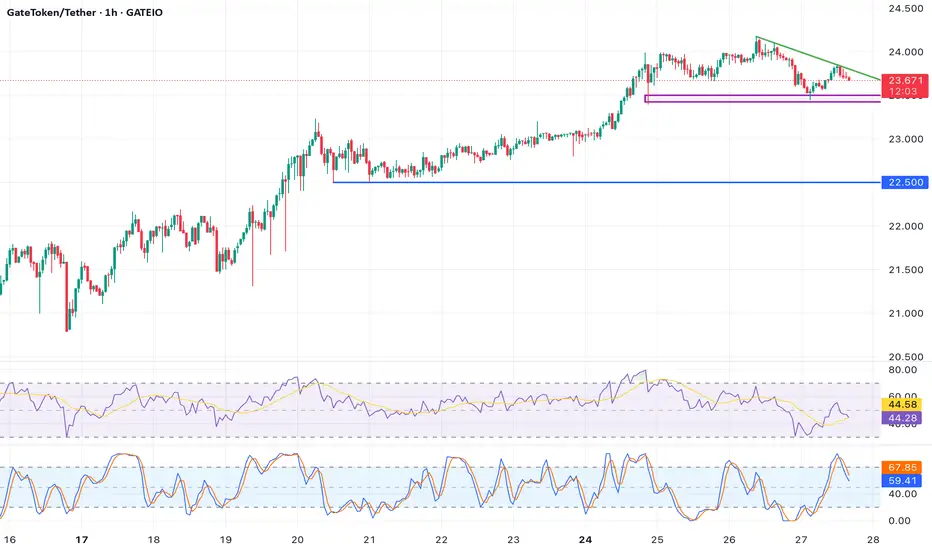
The daily chart shows that since breaking through the weekly descending trendline, GT has consistently traded above the EMA55 (currently 22.10), forming a bullish continuation structure. Key signals:
MACD multi-timeframe alignment:
Daily MACD lines have formed a bullish crossover above the zero line for the second time.
Weekly MACD shows a bullish divergence, reinforcing strength.
Volume-price consolidation:
The recent 5-day pullback saw volume shrink to 65% of the 30-day average, indicating a classic shakeout pattern.
Fibonacci confluence:
24.80 acts as a critical resistance zone, combining the 1.618 extension level and the Q3 2023 volume concentration peak. A breakout here could unlock 30%+ upside potential.
Multi-layered support matrix:
Strong support band: $22.80-23.46 (daily EMA55 + 4H 200MA + institutional block buy zone).
Final defense: $21.50 (weekly Bollinger Lower Band + on-chain whale cost base).
Trading framework:
Entry: Initiate light longs at current 24.30, add on dips to 23.46.
Stop-loss: Daily close below 21.40.
Target: 30.60 (2.618 Fibonacci extension).
Breakout strategy: Enter trend-following positions above $25.80 with a risk-reward ratio >3:1.
Disclaimer
The information and publications are not meant to be, and do not constitute, financial, investment, trading, or other types of advice or recommendations supplied or endorsed by TradingView. Read more in the Terms of Use.
Disclaimer
The information and publications are not meant to be, and do not constitute, financial, investment, trading, or other types of advice or recommendations supplied or endorsed by TradingView. Read more in the Terms of Use.
