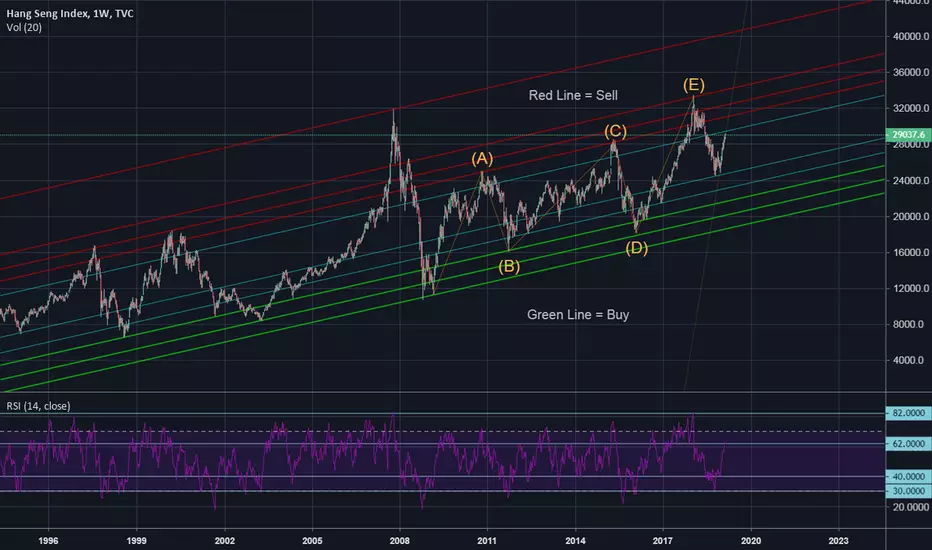
SELL When:
- RSI reaches 82
- Touches the RED Line with RSI reaches 70
- Bearish RSI Divergence occurs
BUY When:
- Touches the GREEN Line with RSI reaches 30
- Bullish RSI Divergence occurs
- RSI reaches 82
- Touches the RED Line with RSI reaches 70
- Bearish RSI Divergence occurs
BUY When:
- Touches the GREEN Line with RSI reaches 30
- Bullish RSI Divergence occurs
Disclaimer
The information and publications are not meant to be, and do not constitute, financial, investment, trading, or other types of advice or recommendations supplied or endorsed by TradingView. Read more in the Terms of Use.
Disclaimer
The information and publications are not meant to be, and do not constitute, financial, investment, trading, or other types of advice or recommendations supplied or endorsed by TradingView. Read more in the Terms of Use.