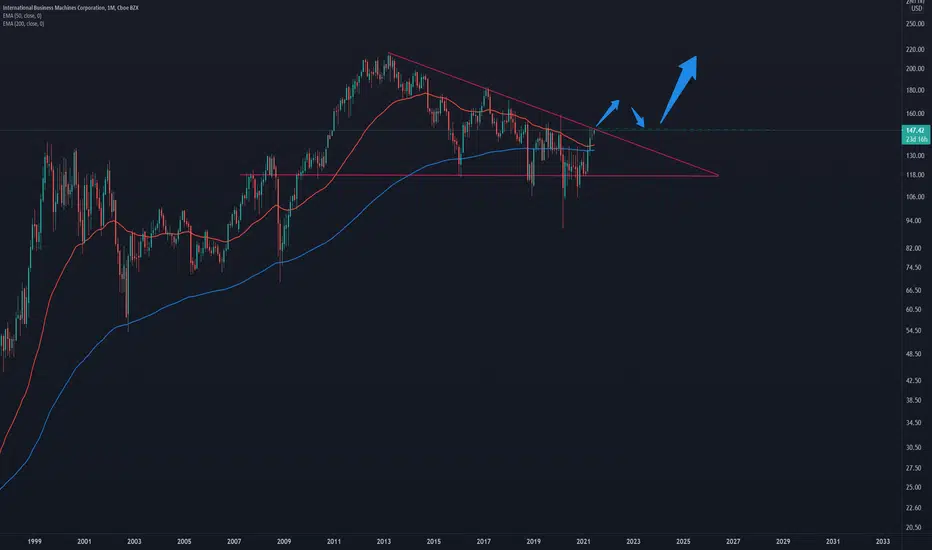
IBM monthly chart is potentially about to breakout of an almost decade long triangle pattern .
50 EMA came down to the 200 EMA and just turned back up.
If it breaks out successfully I would expect prices to go back to the 2013 ATH .
50 EMA came down to the 200 EMA and just turned back up.
If it breaks out successfully I would expect prices to go back to the 2013 ATH .
Disclaimer
The information and publications are not meant to be, and do not constitute, financial, investment, trading, or other types of advice or recommendations supplied or endorsed by TradingView. Read more in the Terms of Use.
Disclaimer
The information and publications are not meant to be, and do not constitute, financial, investment, trading, or other types of advice or recommendations supplied or endorsed by TradingView. Read more in the Terms of Use.