Technical Analysis of MMTC
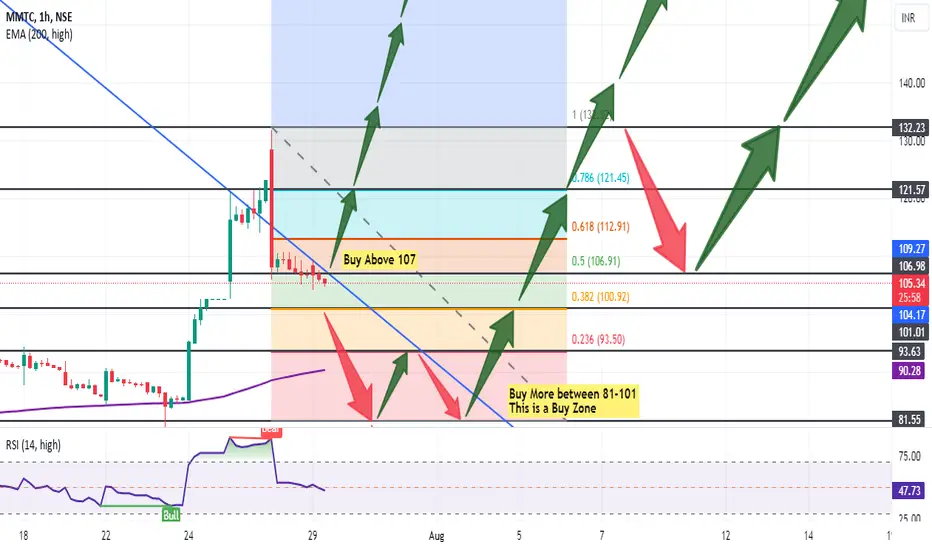
Overview of the Stock - The chart presents a technical analysis of MMTC on a 1-hour timeframe. It employs several tools and indicators to assess the stock's potential movement.
Key Indicators and Observations
Price Action: The price has been in an uptrend, with higher highs and higher lows. However, it appears to be facing resistance near the 107 level.
Moving Averages:- The EMA (200, high) is below the current price, suggesting an overall bullish trend.
Fibonacci Retracement:- The price is currently around the 0.5 Fibonacci level, which is often considered a significant support or resistance area.
Support and Resistance: The chart identifies potential support zones between 81 and 101, and a resistance level near 107 also mentioned on the chart
RSI (Relative Strength Index): The RSI is around 47, indicating a neutral to slightly oversold condition.
Buy Signal- The analyst has marked a potential "Buy Zone" between the price levels of 81 and 101. This suggests that buying opportunities may arise within this range. Additionally, my recommendation to "Buy Above 107" indicates a potential breakout level.
Interpretation
Based on the provided chart, the overall sentiment for MMTC appears bullish. The uptrend, support levels, and potential buy zones suggest opportunities for upward price movement.
However, it's crucial to monitor the price action closely, as it approaches the 107 resistance level. A breakout above this level could signal further bullish momentum.
Important Considerations:
Timeframe: The analysis is based on a 1-hour timeframe. Different timeframes can provide varying perspectives.
Other Indicators: The chart only includes a limited set of indicators. Additional technical analysis tools could offer further insights.
Fundamental Analysis: Technical analysis should be complemented with fundamental analysis to make well-rounded investment decisions.
Further Analysis:- To gain a deeper understanding of MMTC's potential, consider:
Remember, past performance is not indicative of future results.
Disclaimer: This analysis is based solely on the provided chart and does not constitute financial advice. Always conduct thorough research and consider consulting with a financial advisor before making investment decisions as I am not SEBI registered person and this is my personal opinion about the stock
Thanks for your support as always
Overview of the Stock - The chart presents a technical analysis of MMTC on a 1-hour timeframe. It employs several tools and indicators to assess the stock's potential movement.
Key Indicators and Observations
Price Action: The price has been in an uptrend, with higher highs and higher lows. However, it appears to be facing resistance near the 107 level.
Moving Averages:- The EMA (200, high) is below the current price, suggesting an overall bullish trend.
Fibonacci Retracement:- The price is currently around the 0.5 Fibonacci level, which is often considered a significant support or resistance area.
Support and Resistance: The chart identifies potential support zones between 81 and 101, and a resistance level near 107 also mentioned on the chart
RSI (Relative Strength Index): The RSI is around 47, indicating a neutral to slightly oversold condition.
Buy Signal- The analyst has marked a potential "Buy Zone" between the price levels of 81 and 101. This suggests that buying opportunities may arise within this range. Additionally, my recommendation to "Buy Above 107" indicates a potential breakout level.
Interpretation
Based on the provided chart, the overall sentiment for MMTC appears bullish. The uptrend, support levels, and potential buy zones suggest opportunities for upward price movement.
However, it's crucial to monitor the price action closely, as it approaches the 107 resistance level. A breakout above this level could signal further bullish momentum.
Important Considerations:
Timeframe: The analysis is based on a 1-hour timeframe. Different timeframes can provide varying perspectives.
Other Indicators: The chart only includes a limited set of indicators. Additional technical analysis tools could offer further insights.
Fundamental Analysis: Technical analysis should be complemented with fundamental analysis to make well-rounded investment decisions.
Further Analysis:- To gain a deeper understanding of MMTC's potential, consider:
- Analyzing longer-term charts (daily, weekly)
- Incorporating additional technical indicators (e.g., MACD, Bollinger Bands)
- Evaluating the company's financial performance and industry trends.
Remember, past performance is not indicative of future results.
Disclaimer: This analysis is based solely on the provided chart and does not constitute financial advice. Always conduct thorough research and consider consulting with a financial advisor before making investment decisions as I am not SEBI registered person and this is my personal opinion about the stock
Thanks for your support as always
Trade active
MMTC breakout upside from resistance level 107 and right now it is at 115 and more than 10% profit alreay given todayI am still holding my position
Disclaimer
The information and publications are not meant to be, and do not constitute, financial, investment, trading, or other types of advice or recommendations supplied or endorsed by TradingView. Read more in the Terms of Use.
Disclaimer
The information and publications are not meant to be, and do not constitute, financial, investment, trading, or other types of advice or recommendations supplied or endorsed by TradingView. Read more in the Terms of Use.
