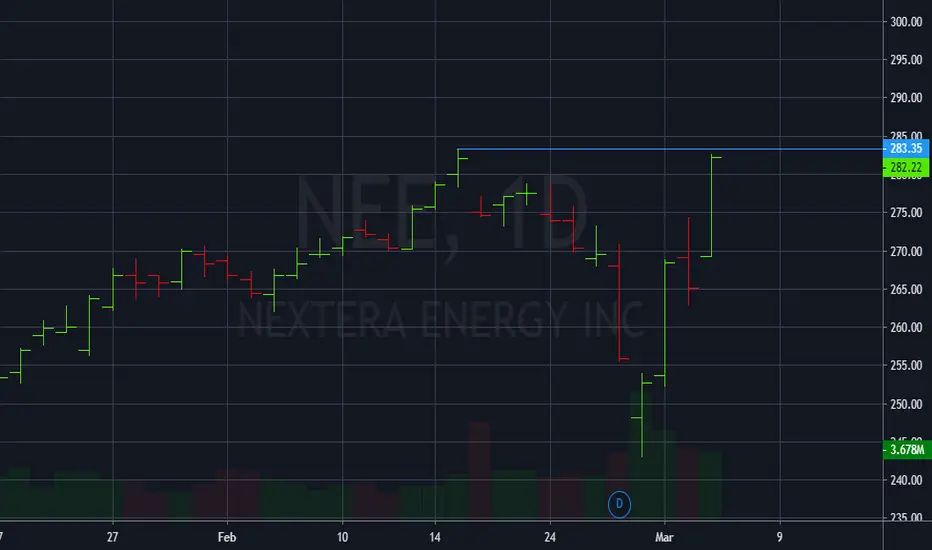
NEXTERA ENERGY INC painted us an interesting picture.
First, on February 18th the tool updated its historical high and stopped at 283.35. But the short player sold his position and the tool rolled back down, in addition to everything, the market situation has done its job.
It is obvious that the instrument follows the market.
Secondly, we can see that we are approaching the level at big bars but at the same time we have closed to the high and to the level.
For those who trade false breakouts - today will be a good deal.
If it manages to get above 283.35, I'm gonna take the long for some days
Order cancelled
there was no enter pointDisclaimer
The information and publications are not meant to be, and do not constitute, financial, investment, trading, or other types of advice or recommendations supplied or endorsed by TradingView. Read more in the Terms of Use.
Disclaimer
The information and publications are not meant to be, and do not constitute, financial, investment, trading, or other types of advice or recommendations supplied or endorsed by TradingView. Read more in the Terms of Use.
