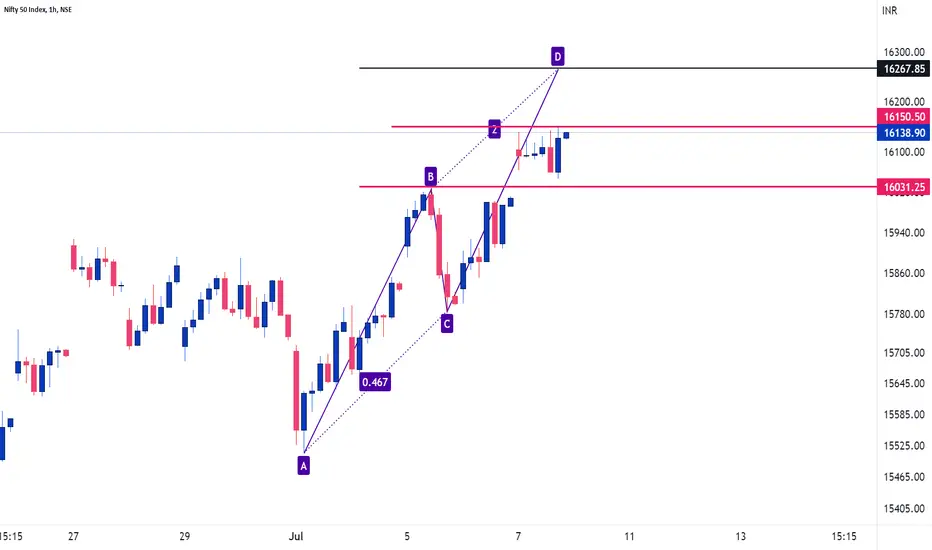
The Index closed in the green on expiry day and maintained a positive sentiment in the market. Today is the last day of the current week, and today is closing matters on the weekly chart.

On the daily chart, The Index has given a breakout for the phycological level(16,000) and sustained above. The main question is, " does the bullish sentiment continue ?"Multi-time frame analysis helps a lot in finding the answer to this question.
ABCD pattern activated, and the PRZ area is 16,344
XABCD pattern also triggered, and the Harmonic PRZ area is 16,610 for the short-term swing
Hourly chart (Intraday )
==================
Used hourly TF to calculate the Intraday levels for the Friday trading session. The lower Time frame also has a Positive Price structure for the target of 16,268.
Intraday Resistance : 16,150
Intraday Support : 16,000
Telegram : t.me/Codeviser
Website: codeviser.org
Follow us on Twitter: twitter.com/CodeVisers
Our Facebook Page: facebook.com/Codevisers
Youtube: youtube.com/c/CodeViser
Website: codeviser.org
Follow us on Twitter: twitter.com/CodeVisers
Our Facebook Page: facebook.com/Codevisers
Youtube: youtube.com/c/CodeViser
Related publications
Disclaimer
The information and publications are not meant to be, and do not constitute, financial, investment, trading, or other types of advice or recommendations supplied or endorsed by TradingView. Read more in the Terms of Use.
