📌 Background
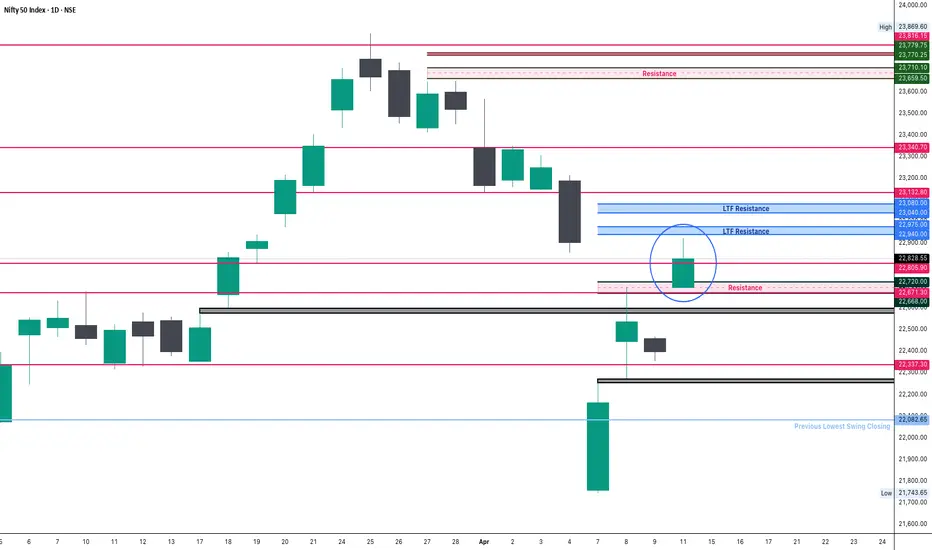
After yesterday’s holiday, global cues were positive—especially from the US markets. SGX Nifty indicated a strong gap-up. As expected, Nifty opened at 22,695, right around the previous session’s high and within our marked Resistance Zone.
📌 Today’s Price ActionNifty opened with a sharp gap-up, and the Initial Balance (IB) high was formed at 22,875. The price managed to breach the IB high briefly, triggering a trade signal and filling the gap between 4th and 7th April sessions.However, the index failed to sustain above 22,875–22,900. Momentum fizzled out post-breakout, and Nifty retraced toward the opening zone.
🧊 Intraday range was 228 points, out of which 165 points occurred during the IB phase. Most of the move was already baked in early on.
📉 Despite gaining +429 points intraday, Nifty closed at 22,828, slightly below the previous week’s high of 22,857—which hints at a pause or temporary exhaustion.
📌 Technical OutlookNifty is still playing between supply and demand zones. Today’s rejection from above 22,900 and close below the weekly high indicates a need for further strength or a catalyst to push beyond 23,000 convincingly. A clean break above 22,900–23,000 remains key.
📌 Important Levels
🔼 Resistance Zones
22,857 (Weekly High)
22,900–23,040
23,182
23,340
🔽 Support Zones
22,668 (Breakout Zone)
22,337
22,082 (Previous Lowest Swing Close)
🧠 Strategy Going ForwardIf no negative news flow arises, a retest of 23,000–23,040 is likely. Traders should wait for sustained price action above 22,900 for fresh longs.Avoid aggressive shorts unless the price breaks down below 22,668 with momentum.
📋 Quick Recap✅ Gap-up opening on global cues✅ IB High breached and gap filled✅ 228-point range; majority in IB✅ Resistance at 22,900 held firm✅ Closed below weekly high
🧘 Patience is power. Wait for confirmation beyond resistance.
Blogs : substack.com/@kzatakia
Related publications
Disclaimer
The information and publications are not meant to be, and do not constitute, financial, investment, trading, or other types of advice or recommendations supplied or endorsed by TradingView. Read more in the Terms of Use.
Blogs : substack.com/@kzatakia
Related publications
Disclaimer
The information and publications are not meant to be, and do not constitute, financial, investment, trading, or other types of advice or recommendations supplied or endorsed by TradingView. Read more in the Terms of Use.