Based on the recent market news and Trump’s speech, here are a few technology stocks that could be worth watching:
Nvidia (NVDA)
* Why? Nvidia remains a dominant player in AI and GPU markets. Despite recent volatility due to tariff concerns, long-term demand for AI chips remains strong.
* Risk: Any tariffs on semiconductor imports could increase costs, but Nvidia’s pricing power could offset this.
Market Structure Overview:
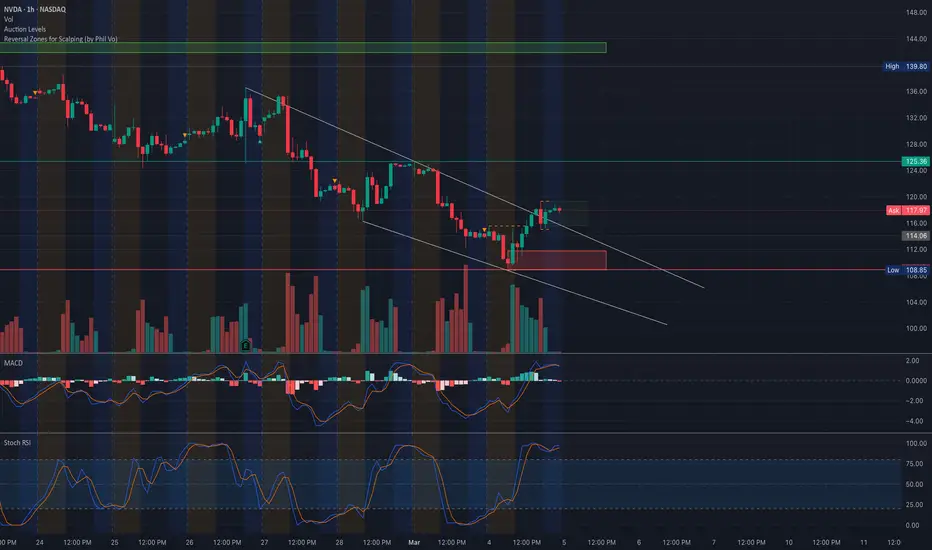
* NVDA has been trading in a descending channel, testing lower support zones.
* Recent price action suggests a potential breakout attempt, but it needs confirmation above $122-$125.
* A strong support zone around $110-$115 is holding, aligning with key volume profile areas.
Supply & Demand Zones:
* Support: $110-$115, major liquidity zone where buyers have stepped in.
* Resistance: $122-$125, aligning with the descending channel’s upper trendline and volume profile high.
Order Blocks & Volume Profile:
* POC (Point of Control): $115.96, indicating this level as a high-volume area.
* VAH (Value Area High): $125.36, which aligns with a breakout level.
* VAL (Value Area Low): $108.85, marking the last line of defense before a bigger drop.
Key Indicators:
* MACD: Showing early signs of bullish crossover, but not fully confirmed.
* Stoch RSI: Overbought, which may indicate a short-term pullback before a continuation.
* Volume: Increasing on the upside, suggesting a potential shift in momentum.
Options Flow & GEX Analysis

Gamma Exposure (GEX) Breakdown:
* Put Walls: Heavy put support at $110 & $115, indicating strong downside defense.
* Call Walls: Major resistance at $130 & $140, suggesting limited upside unless a breakout occurs.
* HVL (High Volatility Level): $122-$125, the key zone where price could see explosive movement.
Implied Volatility & Sentiment:
* IVR: 47.4, showing moderate IV levels.
* Options Oscillator: Call positioning is 14.3%, indicating bullish bets are picking up.
* GEX Signals: Still bearish but decreasing, which means potential for a reversal if buyers step in.
Trade Scenarios & Actionable Plan
Bullish Scenario:
* Entry: Break and hold above $122.
* Target 1: $125.36 (POC Resistance).
* Target 2: $130-$140 (Gamma Call Walls).
* Stop Loss: Below $115.96 (POC).
Bearish Scenario:
* Entry: Rejection at $122-$125.
* Target 1: $115.96 (POC Support).
* Target 2: $110 (Major PUT Wall).
* Stop Loss: Above $125.36.
Final Thoughts & Market Direction
* If NVDA clears $122-$125, we could see a strong push towards $130+.
* If it fails, expect a retest of $115-$110 before another attempt.
* Watch volume and options flow for directional bias confirmation.
🚨 Stay cautious with stop losses and watch the breakout zones! 🚨
📌 Disclaimer:
This analysis is for educational purposes only and does not constitute financial advice. Always do your own research and manage risk accordingly before trading. 🚀📉
Nvidia (NVDA)
* Why? Nvidia remains a dominant player in AI and GPU markets. Despite recent volatility due to tariff concerns, long-term demand for AI chips remains strong.
* Risk: Any tariffs on semiconductor imports could increase costs, but Nvidia’s pricing power could offset this.
Market Structure Overview:
* NVDA has been trading in a descending channel, testing lower support zones.
* Recent price action suggests a potential breakout attempt, but it needs confirmation above $122-$125.
* A strong support zone around $110-$115 is holding, aligning with key volume profile areas.
Supply & Demand Zones:
* Support: $110-$115, major liquidity zone where buyers have stepped in.
* Resistance: $122-$125, aligning with the descending channel’s upper trendline and volume profile high.
Order Blocks & Volume Profile:
* POC (Point of Control): $115.96, indicating this level as a high-volume area.
* VAH (Value Area High): $125.36, which aligns with a breakout level.
* VAL (Value Area Low): $108.85, marking the last line of defense before a bigger drop.
Key Indicators:
* MACD: Showing early signs of bullish crossover, but not fully confirmed.
* Stoch RSI: Overbought, which may indicate a short-term pullback before a continuation.
* Volume: Increasing on the upside, suggesting a potential shift in momentum.
Options Flow & GEX Analysis
Gamma Exposure (GEX) Breakdown:
* Put Walls: Heavy put support at $110 & $115, indicating strong downside defense.
* Call Walls: Major resistance at $130 & $140, suggesting limited upside unless a breakout occurs.
* HVL (High Volatility Level): $122-$125, the key zone where price could see explosive movement.
Implied Volatility & Sentiment:
* IVR: 47.4, showing moderate IV levels.
* Options Oscillator: Call positioning is 14.3%, indicating bullish bets are picking up.
* GEX Signals: Still bearish but decreasing, which means potential for a reversal if buyers step in.
Trade Scenarios & Actionable Plan
Bullish Scenario:
* Entry: Break and hold above $122.
* Target 1: $125.36 (POC Resistance).
* Target 2: $130-$140 (Gamma Call Walls).
* Stop Loss: Below $115.96 (POC).
Bearish Scenario:
* Entry: Rejection at $122-$125.
* Target 1: $115.96 (POC Support).
* Target 2: $110 (Major PUT Wall).
* Stop Loss: Above $125.36.
Final Thoughts & Market Direction
* If NVDA clears $122-$125, we could see a strong push towards $130+.
* If it fails, expect a retest of $115-$110 before another attempt.
* Watch volume and options flow for directional bias confirmation.
🚨 Stay cautious with stop losses and watch the breakout zones! 🚨
📌 Disclaimer:
This analysis is for educational purposes only and does not constitute financial advice. Always do your own research and manage risk accordingly before trading. 🚀📉
Disclaimer
The information and publications are not meant to be, and do not constitute, financial, investment, trading, or other types of advice or recommendations supplied or endorsed by TradingView. Read more in the Terms of Use.
Disclaimer
The information and publications are not meant to be, and do not constitute, financial, investment, trading, or other types of advice or recommendations supplied or endorsed by TradingView. Read more in the Terms of Use.