Looking back:
NZDCAD was on my radar 2 weeks ago since I saw 3 weekly bearish pin bar candles on 3, 10, 17 Dec 2018 reacted with long-term down trendline since 7th Nov 2016. I was waiting for a price pattern since then. I already went short right after seeing bearish candle on 2nd Jan 2019
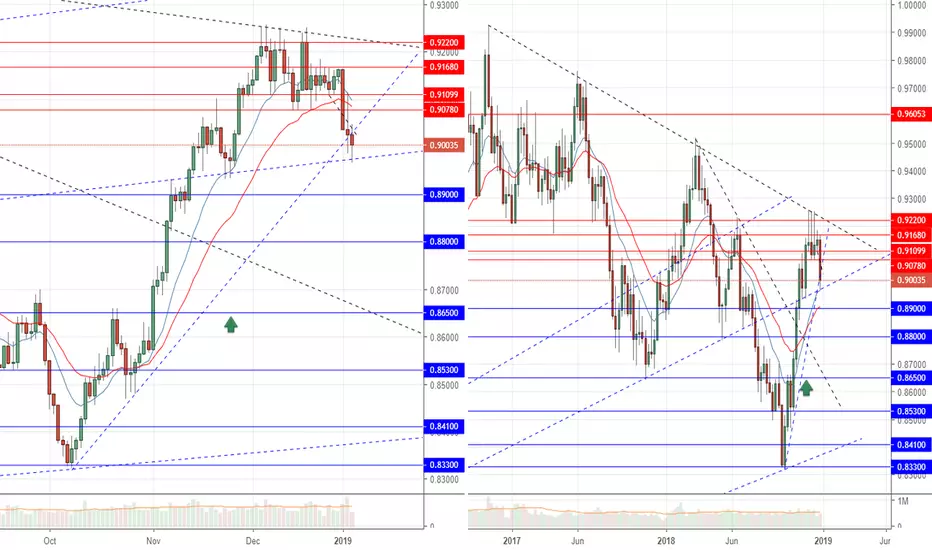
Weekly Chart:
A bearish candle
Daily Chart:
Friday closed with a bearish candle, but we saw the reaction of price with the old long-term trend line since Jan 2009
Watch out:
1. There might be a retest zone 0.907
2. Zone around 0.88-0.89 might be the 1st support
3. Zone around 0.853-0.865 might be stronger support
Action:
Keep holding the short position
NZDCAD was on my radar 2 weeks ago since I saw 3 weekly bearish pin bar candles on 3, 10, 17 Dec 2018 reacted with long-term down trendline since 7th Nov 2016. I was waiting for a price pattern since then. I already went short right after seeing bearish candle on 2nd Jan 2019
Weekly Chart:
A bearish candle
Daily Chart:
Friday closed with a bearish candle, but we saw the reaction of price with the old long-term trend line since Jan 2009
Watch out:
1. There might be a retest zone 0.907
2. Zone around 0.88-0.89 might be the 1st support
3. Zone around 0.853-0.865 might be stronger support
Action:
Keep holding the short position
Disclaimer
The information and publications are not meant to be, and do not constitute, financial, investment, trading, or other types of advice or recommendations supplied or endorsed by TradingView. Read more in the Terms of Use.
Disclaimer
The information and publications are not meant to be, and do not constitute, financial, investment, trading, or other types of advice or recommendations supplied or endorsed by TradingView. Read more in the Terms of Use.