Short
Crude oil POSSIBLE TREND REVERSAL
Hello Traders,
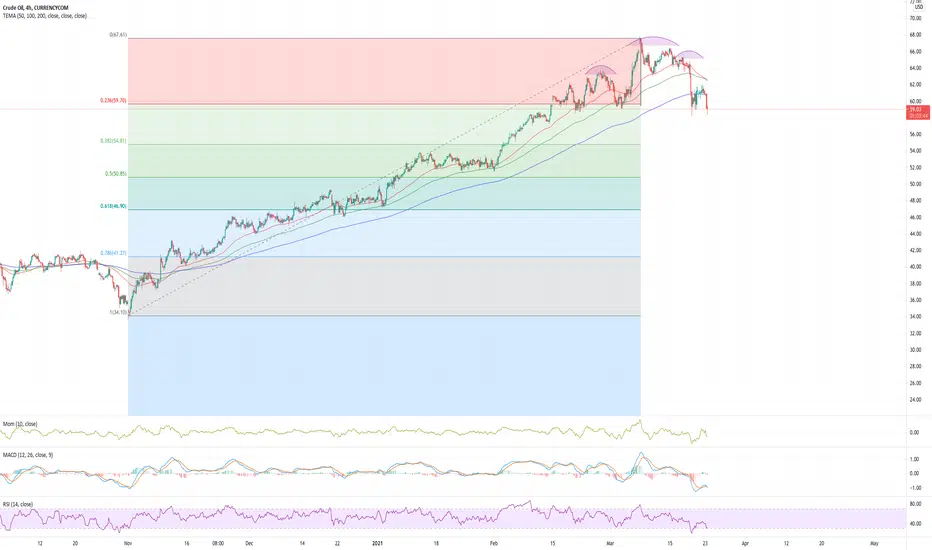
We are liking at the 4 hour graph of crude oil (CFD)
Since my first analysis on tradingview.com was about crude oil i decided to make another good analysis.
As we can see, the short term moving average (RED LINE) is on the verge of breaking through middle term moving average (GREEN LINE) which could indicate a trend reversal. For now, they are kissing.
Furthermore, confirmation of the previous is given when the middle term moving average (GREEN LINE) breaks through the long term moving average (BLUE LINE).
Besides the moving average indicator, we are also seeing a head and shoulders formation. The head and shoulders formation occurs when a market trend is in the process of reversal either from a bullish or bearish trend. In this particular case, it's a possible reversal of a bullish trend.
High risk, high rewards and vice versa.
This analysis is for educational purposes only, I am not a financial advisor.
Smash the like button with love.
Thanks.
Note
Target: 54,81Disclaimer
The information and publications are not meant to be, and do not constitute, financial, investment, trading, or other types of advice or recommendations supplied or endorsed by TradingView. Read more in the Terms of Use.
Disclaimer
The information and publications are not meant to be, and do not constitute, financial, investment, trading, or other types of advice or recommendations supplied or endorsed by TradingView. Read more in the Terms of Use.