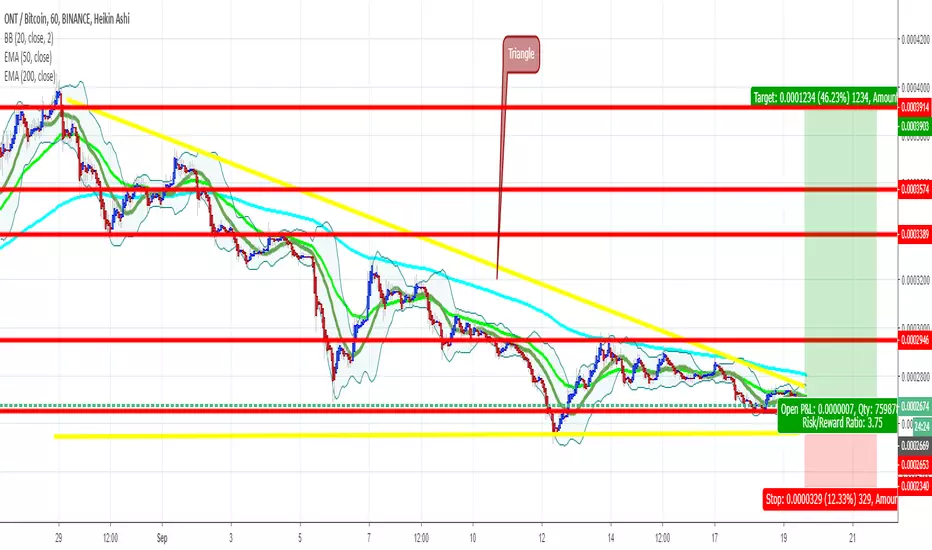
Structure/Trend: From the 29th of August till date has formed a Triangle Trend, there has been constant drop in price (downtrend). However some Support and Resistance levels have been constantly tested, from the 31st August to the 1st September, 0.0003574 has proven a good resistance level, 0.0003389 proved to act as Support on 3rd Sept and Resistance on the 4th Sept. from the 6th till date 0.0002946 has proved to be a strong Resistance testing up to about four times.
Hypothesis: The RSI shows that the price line just recently touched lower limit, the line has risen a little from there on, this shows the price should rise at least for the next 2 days. The trend shows a Triangle, the trend seems to have come to an end, this can either lead to a downtrend or an uptrend. Looking at the trend before the Triangle, the price was more of stable in trend, therefore it cannot be easily predicted the trend to follow after the Triangle. The EMAs show that price has been in a downtrend over time, the EMAs are also above the price bars
Confirmation/Tell: At this point it would be advisable to make a trade move just after the price bar breaks outside the price trend, at this point it would be easier to decipher where the market might move. Also the EMAs being under the price bars would mean an uptrend. These are more confortable zones to make trades in the market.
Target: The Stop Loss was placed well below the lower Support at 0.0002340, the Target Price was place just at the highest Resistance at 0.0003914
Disclaimer
The information and publications are not meant to be, and do not constitute, financial, investment, trading, or other types of advice or recommendations supplied or endorsed by TradingView. Read more in the Terms of Use.
Disclaimer
The information and publications are not meant to be, and do not constitute, financial, investment, trading, or other types of advice or recommendations supplied or endorsed by TradingView. Read more in the Terms of Use.