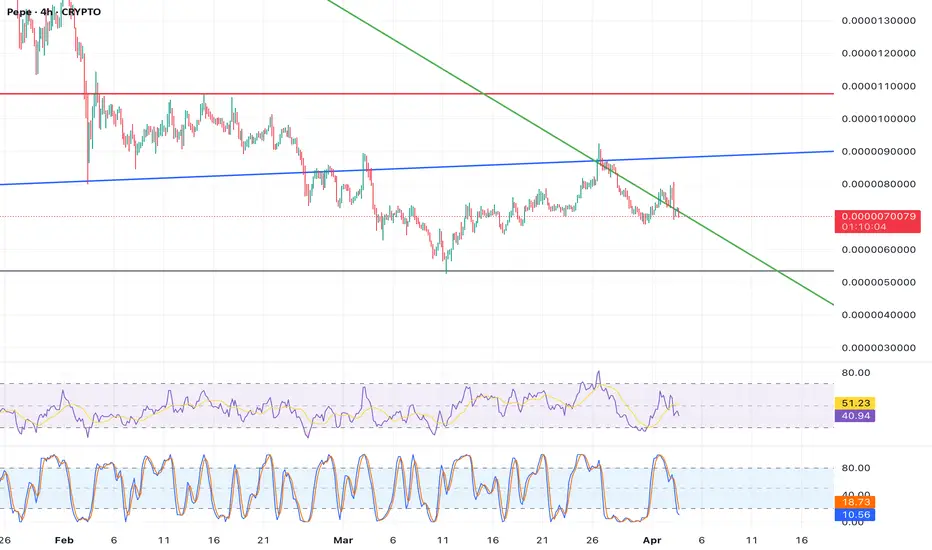
Looking at  GT’s weekly chart, a compelling setup is forming. The stock has been carving out a cup-and-handle pattern since mid-2023, with the cup bottoming near $9 and the handle consolidating around $12. This is a textbook bullish continuation pattern, often preceding explosive moves. The 20-week SMA is sloping upward, supporting the trend, while the ADX is rising above 25, confirming strengthening momentum. However, the handle’s tight range between $11.80 and $12.40 is critical. A breakout above $12.40, especially with a weekly close above it, could target $15—measuring the cup’s depth added to the breakout point. Volume contraction in the handle is typical, but I’d want to see a surge on the breakout for conviction. Conversely, a drop below $11.80 could invalidate the pattern, with support at $10.50 (the 50-week SMA) as the next line of defense. Stochastic RSI is nearing overbought territory, so timing is crucial—overextension could lead to a pullback first. For swing traders, this is a watchlist candidate: go long on a confirmed breakout or short on a breakdown with clear stops.
  GT’s correlation with auto sector trends could also drive volatility, so factor that in!
Disclaimer
The information and publications are not meant to be, and do not constitute, financial, investment, trading, or other types of advice or recommendations supplied or endorsed by TradingView. Read more in the Terms of Use.
Disclaimer
The information and publications are not meant to be, and do not constitute, financial, investment, trading, or other types of advice or recommendations supplied or endorsed by TradingView. Read more in the Terms of Use.
