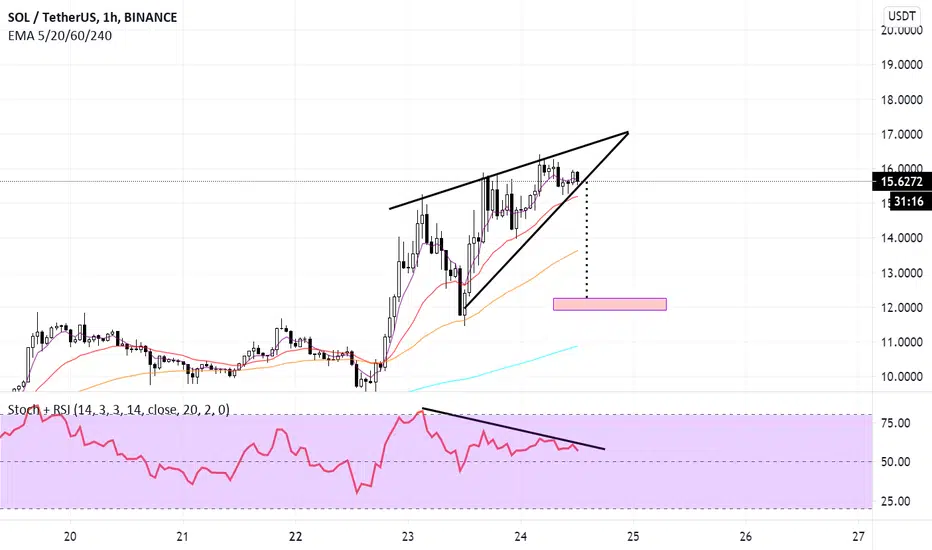
As can be seen in the chart, SOLUSDT shows a bearish divergence on RSI indicator.
In addition, the chart shows an ascending wedge which is also a bearish sign.
In addition, the chart shows an ascending wedge which is also a bearish sign.
Disclaimer
The information and publications are not meant to be, and do not constitute, financial, investment, trading, or other types of advice or recommendations supplied or endorsed by TradingView. Read more in the Terms of Use.
Disclaimer
The information and publications are not meant to be, and do not constitute, financial, investment, trading, or other types of advice or recommendations supplied or endorsed by TradingView. Read more in the Terms of Use.