US stocks fell yesterday
On Monday, the three major indexes have gone down as follows:
the S&P 500 lost 0.90%, the Nasdaq went down 1.49% and Dow Jones closed at -0.49%.
The stock market went down due to the recession fear.
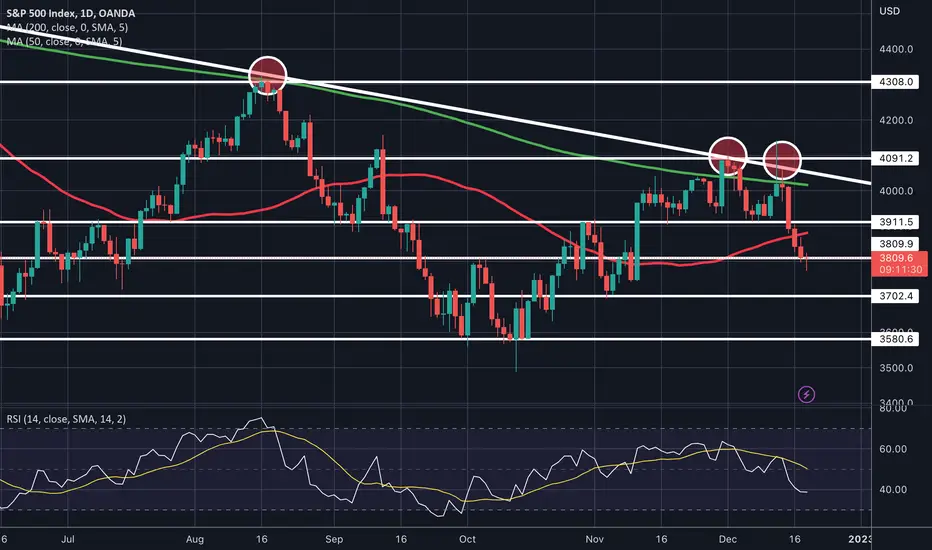
S&P 500 Technical Analysis - Daily Chart
The S&P 500 index has been declining every day since the price was rejected to multiple resistance levels on 13 December 2022 (see red circle on the chart).
The index is now trading below all major moving averages, pointing to a bearish trend.
The 3900 level that was previously a support is now acting as a resistance level.
The price is moving down towards the target of 3600, but it could find temporary support at the 3800 level and then at the 3700 level, before reaching the final target.
After all this negative price action of the past days, we could see a relief rally today towards the 50-day MA (red moving average), which will be the first resistance level.
The RSI dropped further to 40, confirming a bearish trend.
Overall, the index price could fall further in the upcoming days, until it reaches the oversold condition on the RSI.
Sentiment Indicator - Fear & Greed Index
The market sentiment is at 38 in the "Fear" mode which is much lower than a week ago.
The fear of a recession is affecting investors' sentiments, which shifted their sentiment from neutral to fearful in a few days.
Is the Santa Claus rally still possible?
The Santa Claus rally is the positive movement of the S&P 500, which usually rises in the last five trading days of the year and the first two trading days of the new year.
Given the current market conditions, it's likely that the Santa Claus rally might not happen this year, due to fears of a potential recession.
Related publications
Disclaimer
The information and publications are not meant to be, and do not constitute, financial, investment, trading, or other types of advice or recommendations supplied or endorsed by TradingView. Read more in the Terms of Use.
Related publications
Disclaimer
The information and publications are not meant to be, and do not constitute, financial, investment, trading, or other types of advice or recommendations supplied or endorsed by TradingView. Read more in the Terms of Use.
