Wall Street is down after the factory index data
U.S. stocks dropped slightly on Thursday because investors looked at the negative data coming from the Philadelphia Fed factory activity index which keeps falling down for 6 months in a row.
This particular index measures the business activity of manufacturers.
It is important to mention that inverted yield curves in the U.S. are a sign of economic stress and historically are a reliable sign of economic recession.
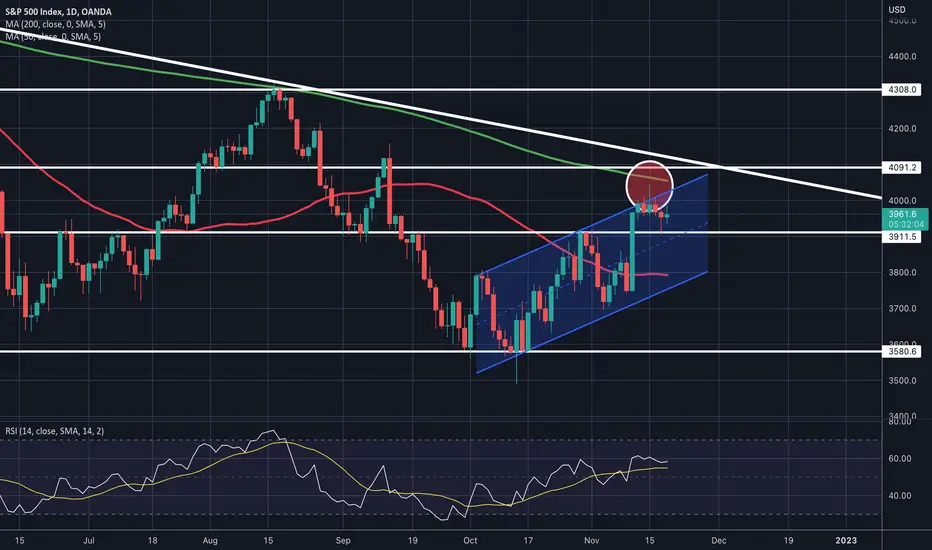
S&P 500 Technical Analysis - Daily Chart
The S&P 500 price is still trading inside an ascending channel.
The support at 3900 has been held in yesterday's trading session and the index is up today, so far.
This is a bullish sign, therefore we can expect the index price to rise to the range between 4054 and 4100, respectively the 200-day MA (green moving average) and the trend line of the bear market.
If the price can break above 200-day MA, it would be a very bullish signal that will push prices even higher and the market could flip potentially to a bull market.
The RSI remains at 60, indicating a Bullish trend.
Market Sentiment - Fear & Greed Index
The market sentiment remains in the "Greed" mode, at 63, only one point higher than yesterday.
FedWatch Tool - FED rates probabilities
80.6% of investors are expecting the FED to increase the interest rates by 0.50% in the next meeting.
The remaining 19.4% are expecting a 0.75% rate increase.
Nothing has changed in the data from yesterday's probabilities.
No other options are considered at this stage.
The next FED meeting is on 14 December 2022.
U.S. stocks dropped slightly on Thursday because investors looked at the negative data coming from the Philadelphia Fed factory activity index which keeps falling down for 6 months in a row.
This particular index measures the business activity of manufacturers.
It is important to mention that inverted yield curves in the U.S. are a sign of economic stress and historically are a reliable sign of economic recession.
S&P 500 Technical Analysis - Daily Chart
The S&P 500 price is still trading inside an ascending channel.
The support at 3900 has been held in yesterday's trading session and the index is up today, so far.
This is a bullish sign, therefore we can expect the index price to rise to the range between 4054 and 4100, respectively the 200-day MA (green moving average) and the trend line of the bear market.
If the price can break above 200-day MA, it would be a very bullish signal that will push prices even higher and the market could flip potentially to a bull market.
The RSI remains at 60, indicating a Bullish trend.
Market Sentiment - Fear & Greed Index
The market sentiment remains in the "Greed" mode, at 63, only one point higher than yesterday.
FedWatch Tool - FED rates probabilities
80.6% of investors are expecting the FED to increase the interest rates by 0.50% in the next meeting.
The remaining 19.4% are expecting a 0.75% rate increase.
Nothing has changed in the data from yesterday's probabilities.
No other options are considered at this stage.
The next FED meeting is on 14 December 2022.
Related publications
Disclaimer
The information and publications are not meant to be, and do not constitute, financial, investment, trading, or other types of advice or recommendations supplied or endorsed by TradingView. Read more in the Terms of Use.
Related publications
Disclaimer
The information and publications are not meant to be, and do not constitute, financial, investment, trading, or other types of advice or recommendations supplied or endorsed by TradingView. Read more in the Terms of Use.