Hello, traders.
If you "Follow", you can always get new information quickly.
Please click "Boost".
Have a nice day today.
-------------------------------------
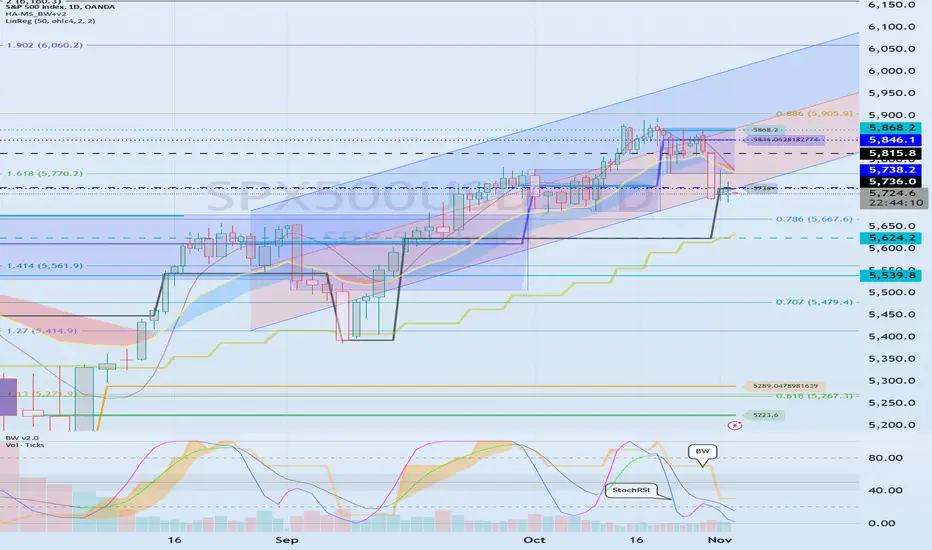
(SPX500USD 1D chart)
In order to maintain the uptrend, it must rise above 5738.2 and be maintained.
Since the StochRSI indicator is currently expected to create a double bottom, if the StochRSI indicator rises in the oversold zone, it is highly likely to create a large uptrend.
Accordingly, I think the 5738.2 point is a very important support and resistance point.
-
(XAUUSD 1D chart)
BW(100) indicator is created at 2748.960, and HA-High indicator is created at 2734.472.
Accordingly, the point of observation is whether it can receive support and rise around 2734.472-2748.960.
-
The fact that BW(100), HA-High indicators are created means that a high point section has been formed.
Therefore, if it receives resistance from BW(100), HA-High indicators and falls, you should basically think that the decline is likely to continue until it meets BW(0), HA-Low indicators and respond accordingly.
Therefore, whether there is support around 2734.472-2748.960 is important.
-
Since the StochRSI indicator appears to have entered the oversold zone, we need to check where it is located when it rises in the oversold zone and maintains the state of StochRSI > StochRSI EMA.
-
(XAGUSD 1D chart)
The chart can be seen as already in the process of decline.
However, since it is maintaining an upward channel, we need to keep in mind the possibility of creating a pull back pattern.
Accordingly, the area around 3188144 is expected to be an important support and resistance zone.
The HA-High indicator is created at the 32.99790 point, and the BW(100) indicator is created at the 34.86 point.
Accordingly, there is a possibility that it will be restricted from breaking through the 3299790-34.86 zone upward.
-
(EURUSD 1D chart)
I think the 1.08821 point is a very important section in the trend.
I think it is likely to have difficulty turning into an upward trend until it rises above the M-Signal indicator on the 1W chart.
Therefore, I think it would be advantageous to proceed with a trade after confirming support near 1.08821.
-
(WTICOUSD 1D chart)
The oil chart is in a reverse arrangement.
Accordingly, I think it would be advantageous to trade with a sell (SHORT) position.
It is currently rising above 71.6167 and rising above the M-Signal indicator on the 1D chart.
In order to maintain this rise, it needs to be maintained around 71.955.
-
HA-Low, HA-High indicators are indicators created to trade using the Heikin-Ashi chart.
The fact that the HA-Low indicator was created means that a low point range has been formed.
Therefore, if it is supported near HA-Low and rises, you should basically think of a response plan by thinking that it will continue to rise until it meets the HA-High indicator.
The HA-Low or HA-HIgh indicators are designed to display box ranges differently from other indicators.
Therefore, in order to escape the low point range formed by the HA-Low indicator, it must rise above the upper point of the HA-Low indicator box.
Therefore, it can be said that it has escaped the low point range if it rises and is maintained above the Fibonacci ratio of 0.618 (72.606).
-
StochRSI indicator is not a universal indicator,
but basically
- When the StochRSI indicator is above the 50 point, you should focus on finding a time to sell,
- When it is below the 50 point, you should focus on finding a time to buy.
From that perspective, I think the current rise is more likely to be a rebound rather than a rise.
-
(BTCUSD 1D chart)
The important support and resistance areas from the current price position are as follows:
- 71288.90-72322.91
- 68343.64-69795.79
- 65910.71
The three areas above are important support and resistance areas.
-
As explained on the oil chart, since the StochRSI indicator is below the 50 point, you should focus on finding a time to buy.
Therefore, if you are trading for the first time, you can trade depending on whether there is support near 68343.64.
However, since the current trend is an upward trend, if you trade with a sell (SHORT) position, you need to respond quickly and briefly.
-
(ETHUSD 1D chart)
ETH is currently moving sideways in the box section.
Therefore, the trend is expected to be determined depending on which direction it deviates from the 2272.88-2707.12 section.
Therefore, you should think about trading within the box section and create a response plan.
Then, when it deviates from the box section, you should switch to a trading strategy to eat the trend.
-
Have a good time.
Thank you.
--------------------------------------------------
Other content (coins, stocks, etc.) is frequently posted on X.
X에 다른 내용(코인, 주식 등)이 자주 게시됩니다.
◆ t.me/readCryptoChannel
[HA-MS Indicator]
bit.ly/3YxHgvN
[DMI-OBV Trend]
bit.ly/4ibHtMc
X에 다른 내용(코인, 주식 등)이 자주 게시됩니다.
◆ t.me/readCryptoChannel
[HA-MS Indicator]
bit.ly/3YxHgvN
[DMI-OBV Trend]
bit.ly/4ibHtMc
Disclaimer
The information and publications are not meant to be, and do not constitute, financial, investment, trading, or other types of advice or recommendations supplied or endorsed by TradingView. Read more in the Terms of Use.