🔎 Overview:
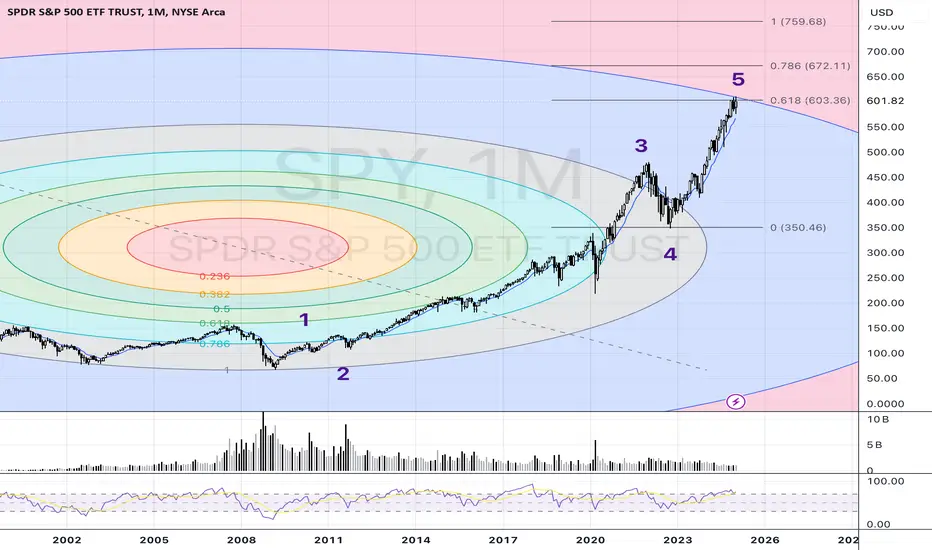
The S&P 500 ETF (SPY) has been in a massive bull run since the 2009 bottom, forming a clear 5-wave structure based on Elliott Wave Theory. Now, the market is showing multiple top signals, suggesting that a major correction may be imminent.
📉 Key Warning Signs:
1️⃣ 5-Wave Completion:
The 5th wave is approaching a key Fibonacci extension level (0.618 of Waves 1-3), a common reversal zone for extended moves.
The previous wave count has been respected perfectly, reinforcing this structure.
2️⃣ Fibonacci Circles Alignment:
Price is reaching the outermost Fibonacci arc, a historically significant zone where reversals have occurred.
The market has reacted strongly in previous arcs, indicating this could be another turning point.
3️⃣ RSI Bearish Divergence:
The Relative Strength Index (RSI) is making lower highs while price is making higher highs—a classic bearish divergence signal.
Previous similar divergences led to major corrections, including 2000, 2008, and 2021 dips.
4️⃣ Overextended Market Conditions:
Volume is declining despite new highs, signaling weak buying pressure.
Sentiment is euphoric, typically a late-stage bull market characteristic.
📊 Possible Scenarios:
🟢 Bullish Case: If SPY breaks and sustains above the 0.786 Fibonacci level (~672), we could see an extension.
🔴 Bearish Case: A break below 600 and a weekly close under 575 would confirm the start of a major correction back to the 350-400 zone (previous wave 4 region).
🚨 Final Thoughts:
The technical evidence suggests that SPY is in a late-stage bull cycle, and the risk of a major pullback is high. While timing exact tops is difficult, long-term investors should be cautious, and traders may want to start looking at hedging strategies or taking partial profits.
📢 What’s your take? Are we near a major top, or is there more upside left? Drop your thoughts in the comments! 👇
#SPY #SP500 #StockMarket #ElliottWave #Fibonacci #RSI #BearishDivergence #Trading #Investing 🚀📉
Disclaimer
The information and publications are not meant to be, and do not constitute, financial, investment, trading, or other types of advice or recommendations supplied or endorsed by TradingView. Read more in the Terms of Use.
Disclaimer
The information and publications are not meant to be, and do not constitute, financial, investment, trading, or other types of advice or recommendations supplied or endorsed by TradingView. Read more in the Terms of Use.